Observability
What is Observability?
Applied to IT, observability is how the current state of an application can be assessed based on the data it generates. Applications and the IT components they use provide outputs in the form of metrics, events, logs and traces (MELT). Analysis of metrics, logs and traces is used to estimate the health of the target application.
Users often question the difference between monitoring and observability. Simply put, monitoring tells you when an issue occurred, whereas observability tells you why it occurred. While monitoring is limited to simply informing you when a change in performance, usage, or availability occurs in an IT system (i.e., an anomaly happens), observability provides the details necessary for you to understand why this change occurred.
Why is Observability important?
Many companies are entering an age of complete digital transformation, updating their applications and moving everything to the cloud. While this streamlines processes and enhances productivity, it also complicates systems. While monitoring CPU usage, memory, databases, and networks is enough to spot, understand, and fix problems in a simple system, this approach doesn’t work as well in more complex systems.
Distributed systems have a lot of moving parts, which also means a higher number and variety of possible failures. In fact, a new failure opportunity is created with each system update. While most issues in these systems go unseen, observability allows for effective analysis and troubleshooting across the full IT stack.
This is because IT observability enables teams to overcome the unpredictable nature of complex systems so organizations can become proactive instead of reactive. When you have questions about your system’s behavior and why particular events are happening, observability will help you answer them so you can ensure accurate diagnosis and deploy timely solutions.
What are the benefits of Observability?
There is no shortage of benefits to implementing an observability solution for your IT infrastructure.
The overall goal of observability is to maintain secure systems that comply with all applicable regulations. To accomplish this, you must see and understand what’s happening across all of your environments and technologies.
Observability helps you accomplish this by eliminating work silos, creating a central source of truth, and making workflows efficient so you can properly investigate issues, distill actionable insights, prevent performance bottlenecks and outages, and ultimately deliver an exceptional experience all around.
What are the three pillars of Observability?
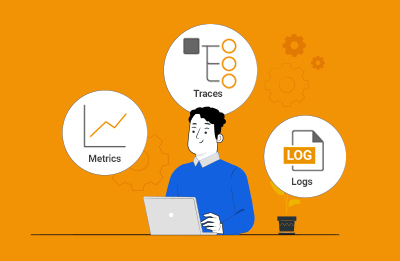
Metrics, Logs and Traces are often referred to as The Three Pillars of “Observability“. The term observability has been used in control theory to refer to how the state of a system can be inferred from the system’s external outputs.
The “Three Pillars of Observability” as defined as Metrics, Logs and Traces, all rely on the concept of “Events”. Events are essentially the basic building blocks of monitoring and telemetry. An occurrence that can be defined, something discrete and unique that happened. An event will have happened at a specific time and have some quantitative measure to determine that it has occurred.
Metrics
Metrics are numerical measurements with attributes that provide an indication of the health of one aspect of a system. In many scenarios, metric collection is intuitive – CPU, memory, and disk utilization are obvious natural metrics associated with the health of a system. But there are usually several other key indicators that can highlight issues in the system.
Great care must be taken in figuring out which metrics to collect on an on-going basis and how to analyze them. This is where domain expertise comes in. While most tools can capture obvious problems that occur, the best ones have the additional insights to detect and alert on the toughest of problems. Measures must also be taken to understand which of the thousands of metrics can be proactive indicators of problems in a system.
Logs
Logs often contain granular details of an application’s request processing stages. Exceptions in logs can provide indicators of problems in an application. Monitoring errors and exceptions in logs is an integral part of an observability solution. Parsing logs can also provide insights into application performance.
In fact, there are insights available in logs that may not be obtained through APIs (Application Programming Interfaces) or from application databases. Application ISVs (Independent Software Vendors) often do not provide alternative mechanisms to access the data they expose via logs. An observability solution must allow analysis of logs and even capturing of log data and correlating it with metric and trace data.
Traces
Tracing is a relatively new concept. Given the nature of modern applications, tracing must be done in a distributed manner. Data from multiple components is stitched together to produce a trace that shows the workflow of single request through a distributed system, end-to-end.
Tracing helps break down end-to-end latency and attribute it to different tiers/components, helping to identify where the bottlenecks are. While traces may not tell you why a system is misbehaving, they can help narrow down which of the thousands of components supporting an application is at fault.
Learn more about the three pillars of observability and how eG Enterprise offers a full-stack observability solution.


