What is an IT Incident and why is IT Incident Management important?
An IT incident is an unplanned disruption that negatively impacts an IT service. As the importance of IT to the business has increased, the impact of IT incidents has become greater. IT incidents can result in revenue loss, loss of employee productivity, SLA financial penalties, government fines, and more. An effective IT incident management strategy is now essential in every organization.
For a business like Amazon whose entire business relies on IT, a single second of slowness can cost over $15,000. IT incident management focuses on the processes that are aimed to restore normal service operation as quickly as possible and minimize the adverse impact on the business.
This blog focuses on the top 10 mistakes to avoid when framing your IT incident management strategy. Based on this, you should be able to develop key criteria to which you can adapt your IT incident management strategy to avoid oversights and gaps and avoid unnecessary retrospective change.
1. Deploy monitoring as an afterthought to your IT incident management strategy
 IT monitoring tools are fundamental for an IT incident management strategy as they provide insights into the functioning of your IT infrastructure and applications. Yet, in many IT projects, monitoring is an afterthought. The deployment focus tends to be on the architecture, enabling technologies (what virtualization platform, what storage, what application server, etc.) and sizing the deployment. While all of these are important, monitoring is not deployed upfront, or sufficient visibility is not provided to the IT team and as a result, when a problem happens, the IT operations team is often asking the question “what changed” and they have no answers.
Deploying a monitoring tool after problems have happened may not be as effective as you do not have the performance baselines that are needed to know what changed and where. As a result, many IT organizations spend a lot of time and effort troubleshooting issues to determine what caused the problem. Often, a server reboot fixes the issue temporarily, and then the problem reoccurs again and again.
 |
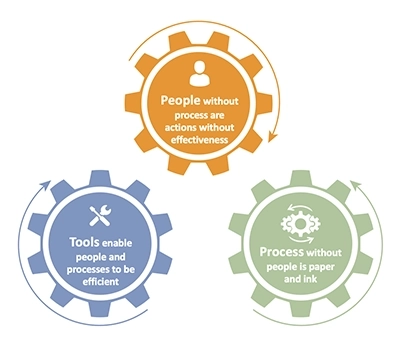
What you should do: Monitoring capabilities are an insurance for your IT infrastructure. Just like you don’t buy a new car or a new home without insurance, you cannot deploy new IT infrastructure and applications without the right IT monitoring tools in place. If you don’t put monitoring in upfront, retrospective addition is often a hurried non-systematic process that is less cost effective and has lower ROIs. Of course, tools alone are not sufficient either and must be augmented with people and processes.
|
2. Adopting a silo-based monitoring and IT incident management strategy
IT organizations are often structured in silos. There may be a network team, a server team, a virtualization team, a cloud team, an application team, a database team and so on. All of these teams rely on specialized tools to administer and operate their respective tiers. From a monitoring perspective, these teams often also have some degree of autonomy to choose the tools they prefer and which match their skills and needs.
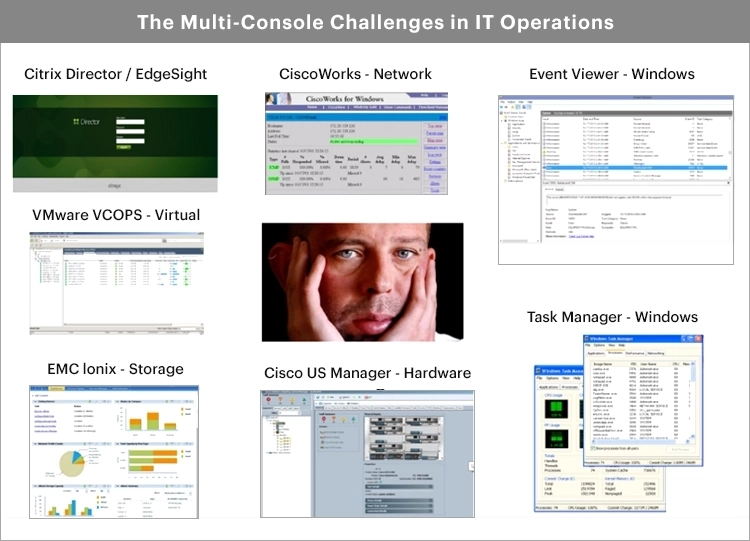
A problem that results from a siloed strategy for IT monitoring is that while most organizations have a large number of monitoring tools, they spend a lot of time in troubleshooting.
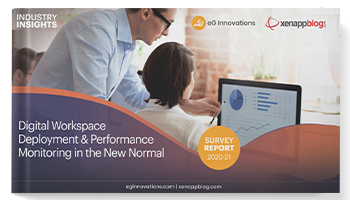 Statistics from a Digital Workspace survey showed the average administrator spends over 20% of their time fire-fighting.
Source: Digital Workspaces in the New Normal Survey Report (eginnovations.com)
When a user complains that “the application is slow”, it can take hours or days to determine where the problem lies and there is often a lot of finger-pointing across the different teams. This is a direct result of not having a single pane of glass view of the entire IT service delivery chain. If you need to detect problems proactively and troubleshoot them quickly, pinpointing where the root-cause of a problem lies is a key. This process will be manual, require experts, and will take a long time if your monitoring portfolio is a collection of a number of different tools, with a different set tools in each silo of your IT environment.
In larger organizations, it is very likely there will be some degree of autonomy within teams and some teams may operate largely as independent silos choosing the optimal tools for their core remit and matched to the skills and needs of their staff. At the same time, it’s unrealistic to expect all your teams to use the same tool(s).
A key criterion should be that there is a single pane of glass overview that can be used where remits overlap, and information needs to be shared across teams. For deep-dive troubleshooting requirements within a domain, there can still be additional toolsets used. Taking a medical analogy, the single pane of glass is like a general physician who is determining where the problem lies and the deep-dive tools as being specialists that can provide the details necessary to resolve the problem. See: How to Overcome IT Monitoring Tool Sprawl | eG Innovations.
 |
What you should do: Adopt a service oriented methodology for incident management. Incorporate tools that track your IT services not as individual silos but as business services. Doing so will enhance collaboration within your team and reduce the blame game.
|
 |
Read Barry Schiffer’s blog showing a real world case study of troubleshooting a business-critical application in the cloud across a siloed organization: Challenges in Supporting Key Cloud Business Applications (eginnovations.com).
|
3. Having blind spots in your instrumentation
 End-to-end visibility is often critical for an effective IT incident management strategy. When you look to monitor all the tiers involved in service delivery, make sure that you have as much insight as possible and that there are no missing links, no matter how trivial it might seem. Blind spots in your visibility can cost you hours of productivity and downtime. This is becoming more important as IT applications become more distributed, heterogeneous and operate on dynamic and auto-scaling infrastructures.
Read our blog (Select the right AWS EC2 instance type for optimal monitoring) in which we discussed how an IT admin not choosing the right instance type of a cloud VM resulted in a significant application outage. It may seem unnecessary for the application team to look at metrics from the cloud tier, but in this blog, we showed a case where insights within a VM and at the application level were insufficient for problem diagnosis and it was only with visibility into the cloud tier that the problem was identified and resolved.
Transaction tracing capabilities, one of the three pillars of observability, can also help here. Without changing application code directly, observability solutions can provide insights into third party API calls and give an idea of whether external dependencies of your application can be affecting your application’s performance.
Database monitoring is an area often neglected – a large number of organizations use databases on-prem or as cloud services behind their applications and issues in the database layer will eventually lead to application issues and problems for users. A lack of database monitoring is a common oversight. eG Enterprise covers over 500 different technology stacks including databases, see: End-to-End Monitoring: Applications, Cloud, Containers (eginnovations.com).
 |
What you should do: To eliminate blind spots, the IT team has to spend the time determining if the right instrumentation is in place. After all, the team that operates the application and infrastructure will have better insight than a vendor or SI team that is deploying the monitoring. An analysis of past tickets or failure modes of an application can be used to determine if any custom instrumentation must be developed to eliminate key blind spots.
|
4. Getting alerted on critical IT incidents alone
 Many IT teams are concerned about dealing with a flood of alarms and open tickets. As a result, they tune the threshold levels so that the monitoring tool only alerts them to critical incidents. Another reason for such a conservative monitoring strategy is to make sure their dashboards look good in the eyes of management. After all, if an executive sees a lot of alerts, he/she may question the IT team about them. So this is another reason to minimize alerts being shown on a monitoring console.
While this strategy reduces false alerts, it could also result in proactive warnings being missed. For example, congestion on the network or a memory leak in an application often starts off being a minor alert. Over time, if the problem is not addressed, the severity of the issue grows and ultimately becomes an IT incident. IT teams that focus on critical events alone are likely to be reactive, rather than proactive. An effective IT incident management strategy needs to be proactive.
More information on proactive monitoring can be found in: What is Proactive Monitoring and Why it is Important, marketing in the monitoring space often addresses a lack of true proactive capabilities via synthetic monitoring features, which whilst useful will not fill this common gap. This article will help you avoid misleading claims.
 |
What you should do: Look for monitoring tools that employ machine learning and AIOps to set automatic dynamic thresholds for metrics. Not only does this reduce the work that you need to manually to tune thresholds, it is also necessary for dynamic and auto-scaling environments where any form of manual intervention may not be possible in real-time. Perform a periodic review of alerts in the monitoring tool and determine if any thresholds need to be tuned to eliminate false positives.
|
Note: Using tools with anomaly detection can help some organizations such as MSPs meet the criteria for joining accredited cloud vendors programs such as the “AWS Managed Service Provider (MSP) Partner Program Validation Audit“ adding value to their platforms.
5. Monitoring resources, not user experience / touchpoints
 Another mistake that many IT teams make is to focus just on monitoring resources. Just because the CPU usage of your servers is less than 50%, it doesn’t mean that your users are happy! Your Active Directory service may have a replication problem and this could be resulting in user logon failures, and this could even be the reason your server CPU utilization is low!
These days, IT teams are being assessed by the experience of their users. If there is an outage, it draws unwarranted attention to your team. Hence, the need to focus on users more than ever before.
 |
What you should do: Track all aspects of user experience proactively. Ideally, you should deploy a combination of synthetic and real user monitoring (RUM). While real user monitoring is important for you to see the QoS that users are seeing, synthetic monitoring comes in handy especially during times when there are no users. Synthetic monitoring also gives you a repeatable benchmark of user experience, since it is executing the same steps, from the same locations, repeatedly – so any change in user experience is indicative of a problem.
|
Whether you are monitoring real user experience or synthetic experience, make sure you are covering all possible user touchpoints. We once had an experience where we were monitoring a bank’s core banking systems, e-Banking systems, ATMs and others and yet did not catch a critical issue that affected millions of users. The reason – we missed the SMS gateway that sent one time passwords (OTPs) to users. So when the OTP failed, it affected all users and the IT team was not aware of the issue. The lesson we learnt was to make sure we understand and monitor all user touch points!
6. Believing monitoring is an IT operations activity, not a helpdesk one
 The primary users of an IT monitoring tool are the IT operations team. They are the ones who have access to key systems and applications and can resolve issues when they happen. Most of the tools in an organization are available to IT operations whilst IT helpdesks that receive user complaints are often just passing the complaint over to the IT operations teams.
Especially as hybrid work has become common, while many of the complaints to the helpdesk may be about slow desktops and applications, the issue could actually be due to the user end or due to external dependencies that your internal IT team cannot remediate – e.g., antivirus taking up CPU cycles on the user’s laptop, a poor Wi-Fi connection at home, or an outage in Microsoft Azure. Passing such issues to the IT operations team can result in a large number of unnecessary tickets for IT operations to handle and their time and resources are wasted.
Another challenge facing helpdesk teams is that they often have no or little visibility into the IT infrastructure or application health – these insights are only available to IT operations teams. This means when an issue is reported, the helpdesk team has to make a best guess and pass the complaint over to one of the IT operations teams. Because of the inter-dependent nature of IT applications, often what appears to be an application issue may be the result of an infrastructure bottleneck. Therefore, IT operations teams spend a lot of time fire-fighting routine issues. Having effective Helpdesk operations is key to an effective IT management strategy.
 Our survey of digital workspace professionals found that 51% of respondents found that helpdesk staff are not able to help at least 50% of the time. 35% of respondents also stated that more than three quarters of the time they had to handle issues themselves as helpdesk unable to resolve issues.
Source: Digital Workspaces in the New Normal Survey Report (eginnovations.com)
 |
What you should do: We have a detailed article that highlights how you can increase your IT efficiency by empowering IT helpdesks to play an active role in IT incident management, see: Empowering IT Help Desks with IT Service Monitoring. Help desk teams may not have the same expertise as IT operations teams. Hence, providing them with relevant and simplified dashboards, topology views, color cues about problem sources, documentation, knowledge base of problem rectifications and so on are required to make sure that they play an important role in enhancing IT productivity.
|
7. Believing all monitoring tools provide similar metrics
 Many IT admins believe that it does not matter what monitoring tools they use – after all, the core resource utilization metrics collected are the same. However, this is far from the truth. There is a lot of detail that you have to go into in determining whether a monitoring tool is right for your incident management strategy. For example, if you are supporting a large number of remote workers connecting via Citrix, then your IT monitoring tool must have expertise in Citrix technologies. There are a number of key metrics that must be collected to understand Citrix user activity and experience including user logon time, application launch time, screen refresh latency, etc. A breakdown of user logon time is necessary to understand why logon slowness happened – is it due to GPO, or profile loading, or logon script execution, etc. Many traditional system and network monitoring tools do not have expertise with monitoring digital workspaces like Citrix. See: How eG Enterprise addresses the 7 key needs of digital workspace professionals (eginnovations.com).
In a similar vein, if you are using auto-scaling in the cloud, or using microservices and containers, you need to make sure your monitoring tool can auto-discover the infrastructure and applications. Deployment of the tool also has to be automated, probably by integrating with Infrastructure as Code (IaC) and orchestration tools, because the dynamic nature of these environments makes it impossible to do manual provisioning or configuration of the monitoring tool. See: Infrastructure-as-Code series: Practical monitoring in an IaC universe – CW Developer Network (computerweekly.com).
How you plan to use the metrics collected is also important. Some tools may collect metrics every few seconds and display them in dashboards, but when it comes to later analysis, they may be storing only a subset of metrics in the database.
 |
What you should do: Chalk out your main requirements for IT monitoring and prepare an evaluation criteria for comparing different tools. Use past problems as a guide, analyze the steps you had to go through to fix these problems and determine if the tools you are evaluating can help. At the same time, keep your future roadmap in mind as well.
|
8. Using monitoring for troubleshooting only
Many organizations look at IT monitoring tools as being mainly useful for troubleshooting. While this is indeed the case, limiting IT monitoring tools for troubleshooting undervalues their usefulness.
Many of the metrics collected by a monitoring tool can be used to make informed decisions. For example, trends of usage over time may highlight a gradual increase in workload that needs to be factored in when making capacity planning decisions. Particularly when deploying workloads on the cloud, there is limited communication between application and IT teams, and as a result, insufficient thought may have gone into what type of instance is to used.
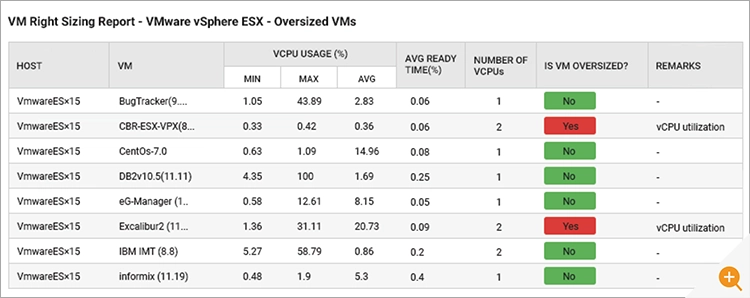
The flip side of this, it also happens sometimes that IT teams may over-provision cloud instances and this can result in a lot of wastage of resources. Monitoring tools can analyze resource usage over time and provide insights into instances of oversizing of instances.
 |
What you should do: Cost-efficiency is important especially when leveraging virtualization, containerization and pay-as-you-use cloud services. Look to leverage monitoring tools to plan for growth and eliminate waste. Features and capabilities to assess should include:
|
9. Focusing on IT availability and performance only
 Historically, IT monitoring and IT incident management has been about monitoring utilization levels and trends of different resources. As IT infrastructures have become multi-tiered, there are more tiers in the service delivery change and more opportunities for failures and bottlenecks.
While bottlenecks could occur because of failure of component (e.g., a failed disk) or because of over utilization (e.g., too many requests), they can also occur because of configuration changes. For example, it is now possible to resize a virtual machine or a cloud instance in one click. In the same way, a cloud instance type can be changed, an update or hotfix can be applied, or a system parameter changed in one click. The person making the change may not have insight into the performance impact of such changes. Read our recent blog post Configuration and Change Tracking is a Key for IT Observability (eginnovations.com), in which we highlighted how an OS security patch significantly impacted application performance and it was using configuration and change management that it was possible to identify the root-cause of the IT incident.
Further details on configuration change tracking are covered in our feature overview, see: Change Tracking and Configuration Monitoring | eG Innovations.
 |
What you should do: If you are tracking performance of your applications and infrastructure and also have insights into what configurations changed at any time, it is relatively easy to then determine if a configuration change caused a performance problem. Knowing this can significantly save your organization time and money.
|
10. Focusing on installation and configuration of the monitoring tool, not on its usage
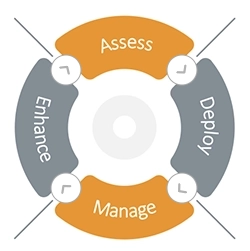 When deploying a monitoring tool, most of the focus tends to be on installation and configuration to get it working. Once deployed, attention shifts to other areas. Monitoring is not a one-off process – it has to be carried out 24×7 throughout the life cycle of your applications and infrastructure.
These days when budgets are tight, when IT services are affected, executives often ask “Did the monitoring tool detect and diagnose the problem?”. While the question is valid, the answer is not always easy.
The answer not only depends on the capabilities of the monitoring tool but also on how well it is deployed and how effectively it is used. For example, if your remote workers are experiencing a service outage and you have synthetic monitoring only deployed within your on-prem data center, you are unlikely to be detecting the problem in advance. Care and thought needs to be put in at the deployment stage with respect to the potential problems that may occur and how the tool deployment can be done to maximize your chance of detecting the problem.
At the same time, you also need to have the right processes and people in place to effectively use the tool. For example, if the monitoring tool highlights data replication between Active Directory systems as being problematic, you need to have the right personnel in place to take action to resolve the problem. A lower skilled IT staff member may understand the significance of such an alert and take action in a timely manner.
 |
What you should do: Make sure you don’t just focus on familiarizing yourself with the capabilities of the monitoring tool. Focus on how it will be deployed, what sort of failures and problems you expect to detect using the tool. Make sure the operations team using the tool has the necessary experience and expertise to use the tool effectively.
|
Note: If using SaaS or native cloud based monitoring tools – consider how will you deal with outages of the SaaS service or cloud? See: How to Protect your IT Ops from Cloud Outages for ideas!
eG Enterprise is an Observability solution for Modern IT. Monitor digital workspaces,
web applications, SaaS services, cloud and containers from a single pane of glass.
Further information
- If you are currently involved in strategic planning or scoping and considering how to ensure good long-term solutions for cloud based applications, services and infrastructure you may find this whitepaper of particular interest: White Paper | Top 10 Requirements for Performance Monitoring of Cloud Applications and Infrastructures (eginnovations.com).
- Another whitepaper covers several common errors and misconceptions regarding cloud monitoring that IT administrators often have to explain during IT projects to management and the wider organization, see: White Paper | Top 6 Myths of Cloud Performance Monitoring (eginnovations.com).




 Shashi joined eG Enterprise last year as a Product Marketing Manager. Many of our customers and partners already knew him well from his previous decade long role at Citrix in the Citrix Ready group where he worked on partner integrations, marketing and solution validation with vendors such as Nutanix, IGEL, Cisco Microsoft and AWS. Today, Shashi undertakes a similar role focussing mainly on ensuring partner projects and solutions are validated and joint technical marketing is appropriate. Shashi's BSc in electronics is particularly useful when working with hardware and infrastructure vendors.


