Is your AVD monitoring strategy truly effective? As organizations increasingly adopt Azure Virtual Desktop (AVD) to support remote work, ensuring a seamless and secure user experience becomes a priority. A robust AVD monitoring, and observability strategy is essential to achieve this, allowing you to maintain performance, security, and user satisfaction across your virtual desktops and apps.
But where do you start? Here are five essential areas to question when developing your AVD monitoring strategy to ensure you are covering some critical requirements.
1. Are You Monitoring AVD to Know When It Is Working and When It Is Not? What Is the Performance and User Experience from Each Location You Care About?
The most fundamental aspect of any AVD monitoring strategy is ensuring that you have real-time insights into the availability and health of your Azure Virtual Desktop environment. AVD performance monitoring is not just about knowing when things are working; it is equally about being alerted as soon as they are not (or even being warned _before_ things actually stop working so that you can avert issues).
Synthetic monitoring is essential for understanding the user experience, especially when monitoring Azure Virtual Desktop (AVD). It helps you determine when AVD is operational and how it performs from specific locations you care about. Unlike relying on user reports or Azure’s often delayed status page, synthetic monitoring provides real-time insights.
By implementing logon simulations (simulating the user logons) and full session simulations (simulating the logon and then working using key apps within the session) from key locations, you can proactively detect issues, assess performance, and ensure a smooth user experience. This benefits the helpdesk by enabling them to inform users about known issues, trigger proactive calls to Microsoft, and resolve problems before they escalate.
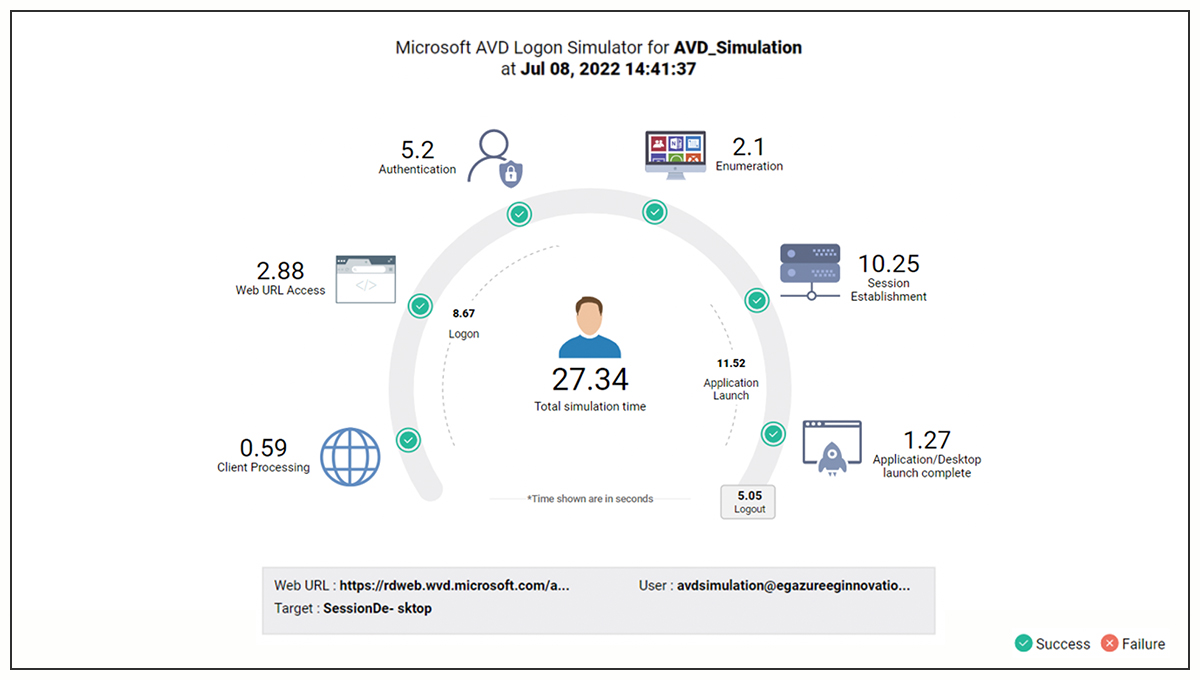
By continuously running synthetic tests from different geographic points, you can identify latency issues, downtime, and response times, ensuring a consistent user experience across various regions, even before real users encounter any problems. Learn more: Synthetic Monitoring of Microsoft Azure DaaS.
A free AVD logon simulator is available here: Free AVD Logon Simulator for Azure VD | eG Innovations.
Note: eG Enterprise’s synthetic monitoring is licensed per test location – i.e. you can perform as many simulations/tests as you like without incurring per test costs, details available – here: eG Enterprise IT Monitoring Licensing – Cost-Effective & Flexible (eginnovations.com).
2. Do You Know Who Is Connecting to AVD, for How Long, and What Apps They Are Using? Can You Provide Evidence for Audits?
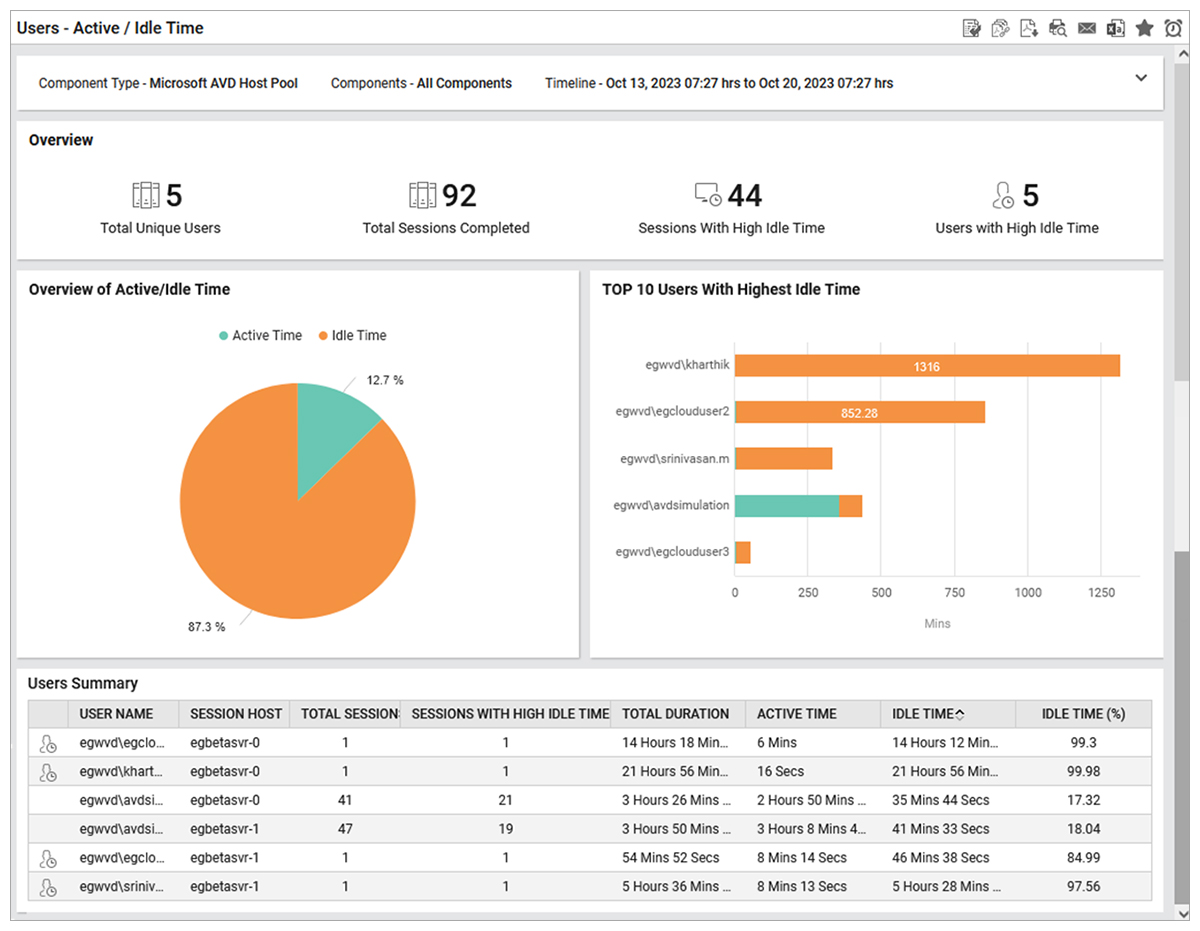
Understanding user behavior within your AVD environment is essential for both operational efficiency and security. Your AVD monitoring strategy should include detailed insights into who is connecting to your virtual desktops, the duration of their sessions, and the specific applications they are using. This not only helps in optimizing resource allocation but also plays a vital role in security and compliance strategies.
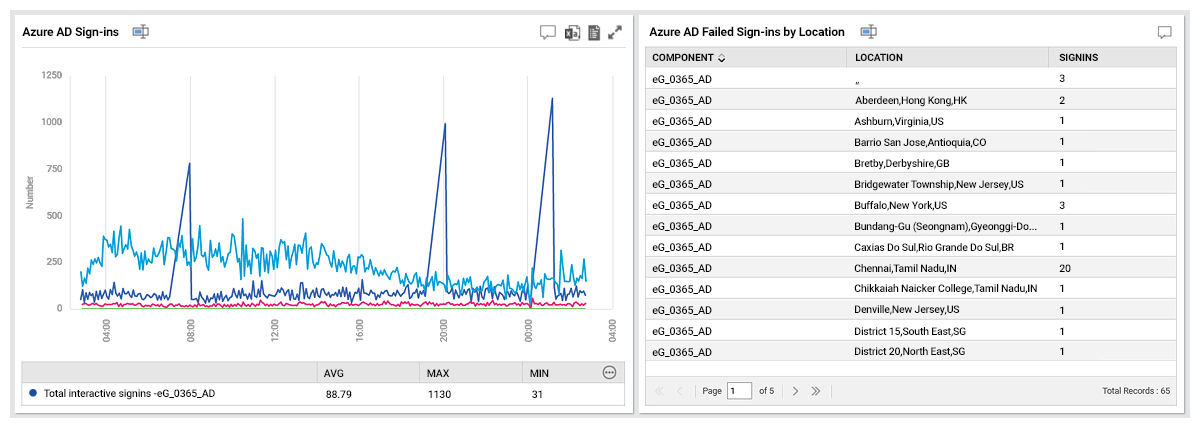
Tracking user activity can help you detect unusual behavior that might indicate a security breach. Additionally, detailed logs of user sessions and application usage are invaluable when it comes to Azure Virtual Desktop audits. Having the ability to provide evidence of compliance with regulatory standards is increasingly important for most organizations and mandatory for many. Good AVD monitoring tools can help ensure that your environment is secure and that you have the necessary traceability and historical reports to satisfy auditors and local regulations.
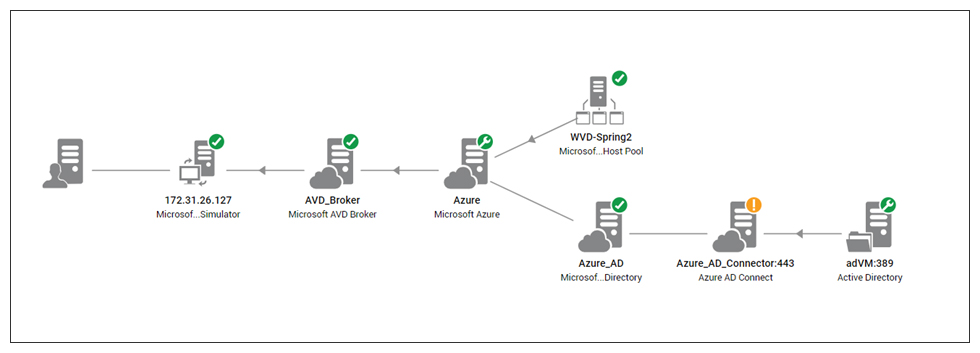
To achieve full visibility of AVD user connections and session usage, you need to leverage an observability solution that monitors more than just AVD hosts, VMs and sessions. Monitoring the authentication and connection technologies in use is essential – technologies such as Entra ID (was Azure AD) and the AVD Broker. Learn more about monitoring Entra ID, here: How to monitor Azure AD Step by Step | eG Innovations.
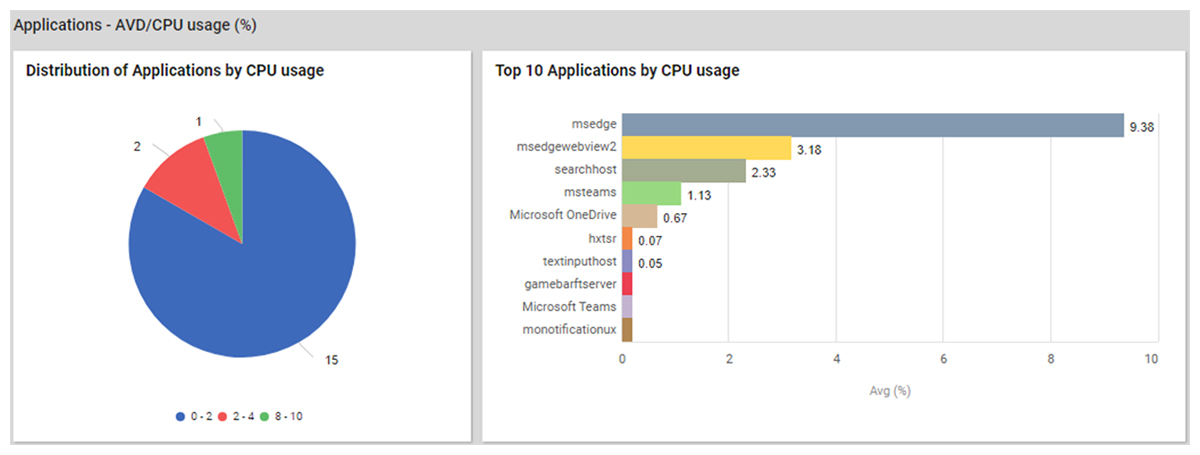
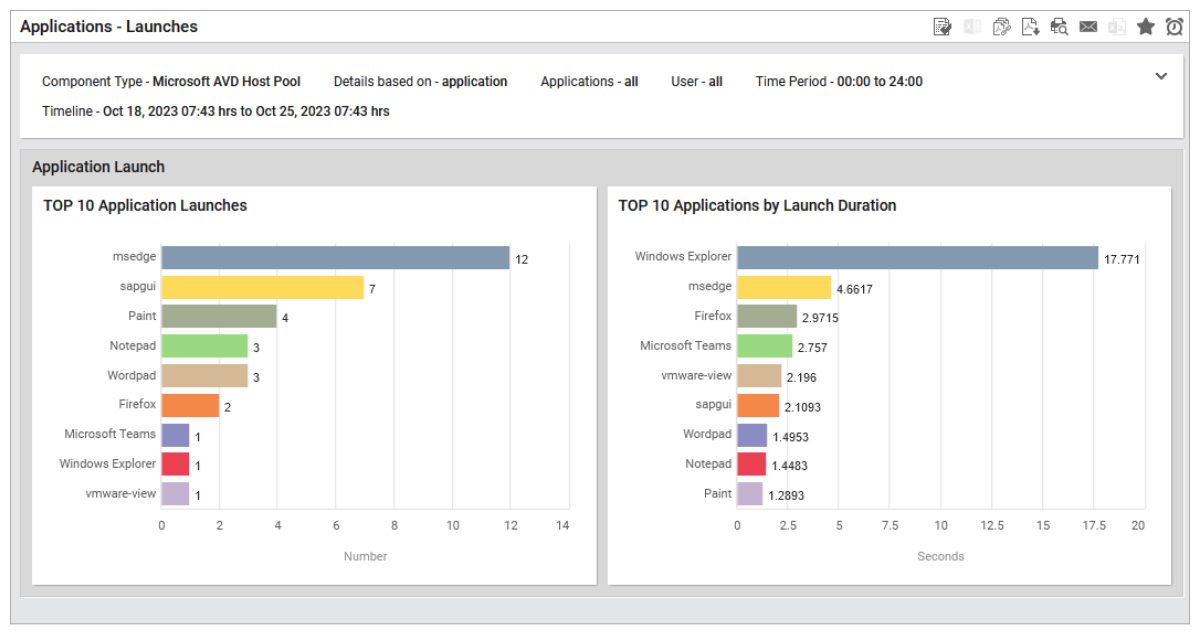
Beyond security, management staff need to understand employee behavior and application usage.
Application reports allow IT Ops to evaluate the popularity of applications and services, combined with application cost reports this can be a powerful tool to evaluate how critical certain apps are and whether they are providing value to the organization.
3. Do You Have a Handle on All Aspects of AVD User Experience – Logon, App Launch, Screen Latency, etc.?
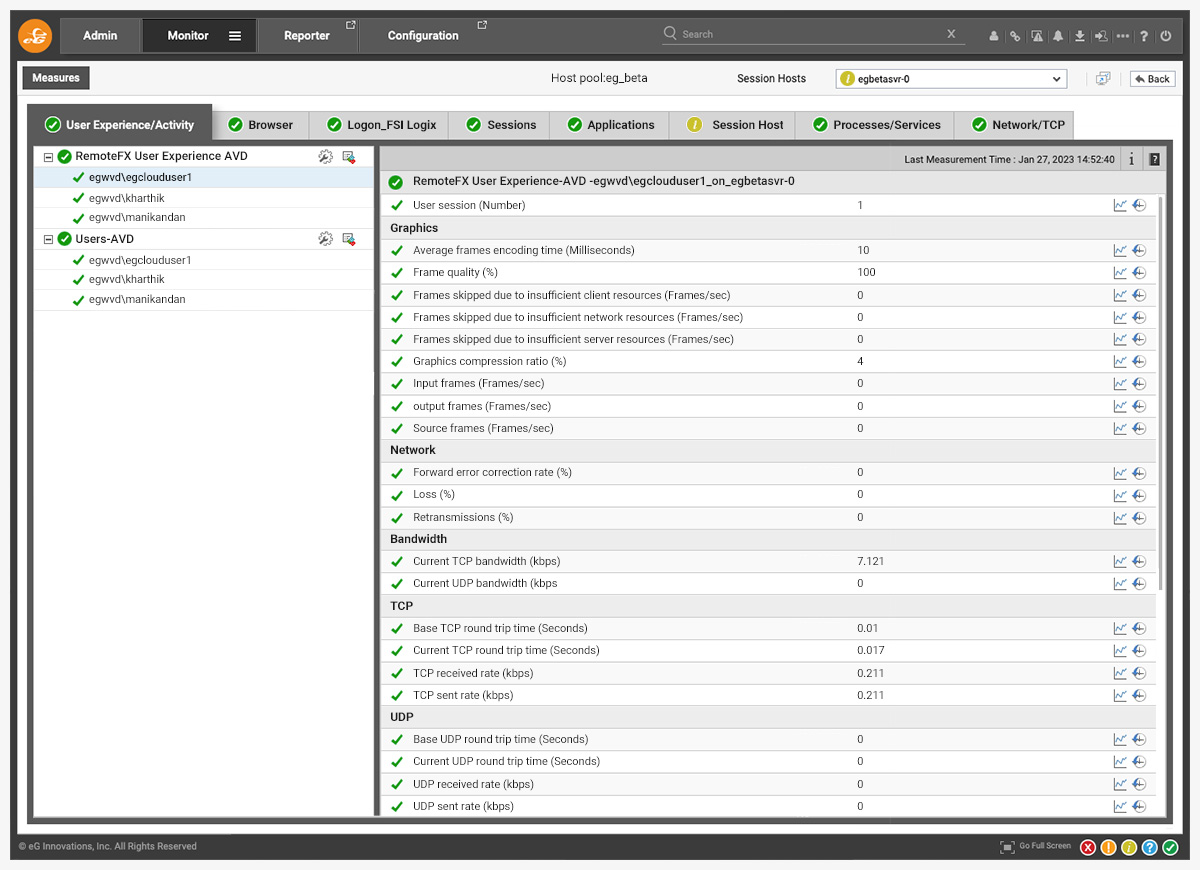
User experience and the digital employee experience (DEX) is at the heart of any virtual desktop environment. An effective AVD monitoring strategy must encompass all facets of user interaction—from logon times and application launch speeds to screen latency.
Real time and historical monitoring of user experience metrics and measures means that:
- management gains a clear view of DEX,
- operations can identify optimization needs,
- and helpdesk teams are informed of issues before users complain.
eG Enterprise provides detailed monitoring with automated, one-click diagnostics (no manual scripts required) that pinpoint the root cause of user experience issues. Learn more: Troubleshooting Azure Virtual Desktop (AVD) Sessions – Key User Experience and Graphics Metrics to Monitor | eG Innovations.
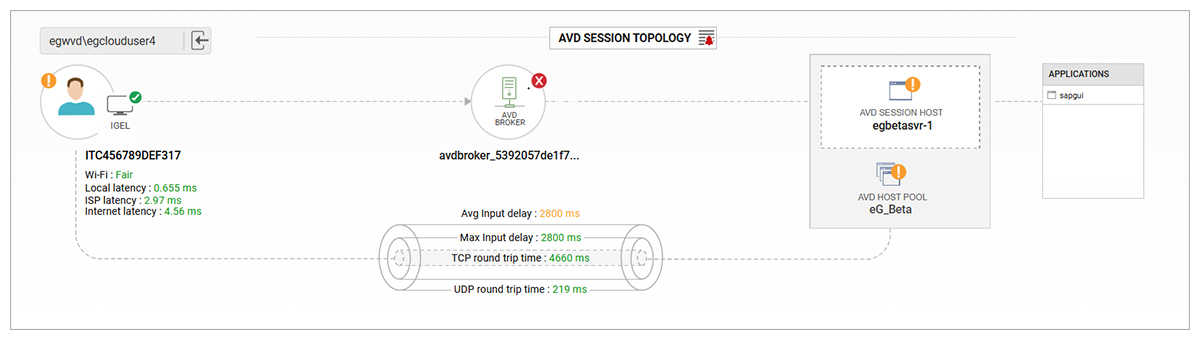
4. Do You Monitor Every Tier of the AVD Delivery Chain and Have the Ability to Troubleshoot Issues Quickly?
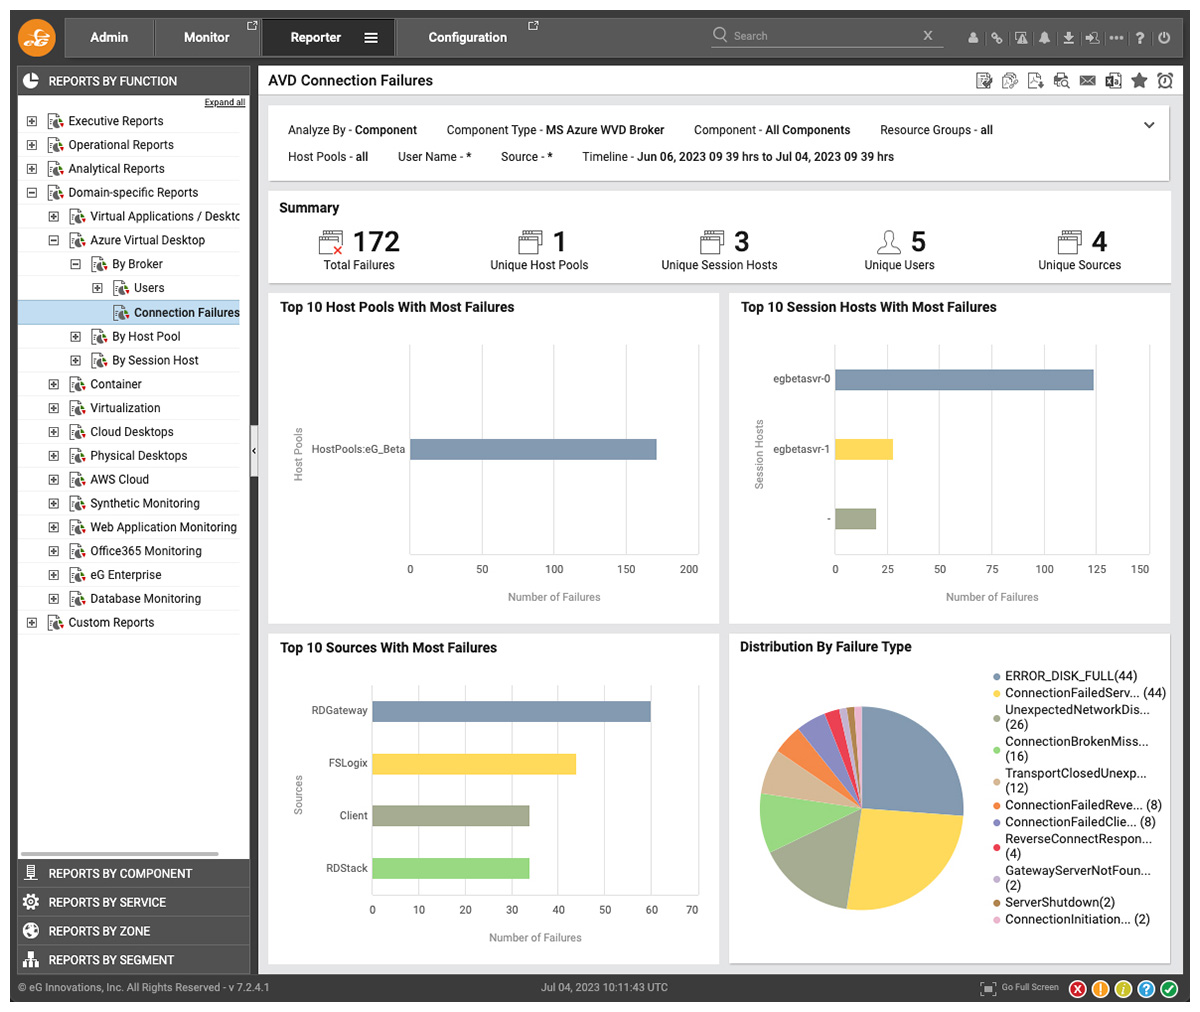
Azure Virtual Desktop environments are complex, comprising multiple tiers that include authentication technologies, network infrastructure, virtualization layers, operating systems, and applications. To maintain a reliable AVD environment, you must monitor every tier of this delivery chain comprehensively. This includes not just the virtual machines and applications but also the underlying network and storage components.
Full end-to-end observability is necessary to identify bottlenecks that might be frustrating your users. For example, long logon times could be a result of inefficient profile loading or FSLogix problems, while slow application launches might be due to resource contention or network issues. AVD monitoring tools must provide you with detailed insights into all dependencies if you need to troubleshoot user experience and infrastructure issues fast. Learn more: Troubleshooting Azure Virtual Desktop (AVD) Issues through Logon and Beyond.
Your AVD monitoring strategy should employ tools that can monitor infrastructure and application layers independently and in conjunction. By doing so, you ensure that issues can be identified no matter where they arise in the delivery chain. Furthermore, having the capability to troubleshoot these issues quickly is essential. This means your monitoring solution should offer real-time alerts and diagnostics that help you pinpoint the root cause of any problem swiftly (preferably a monitoring tool should do this out-of-the-box).
Endpoints are often the source of user experience issues and an AVD monitoring solution should provide insights into the performance of the client device users are using and their final mile network (Wi-Fi / ISP).
Learn more: Troubleshooting Azure Virtual Desktop (AVD) Issues through Logon and Beyond | eG Innovations.
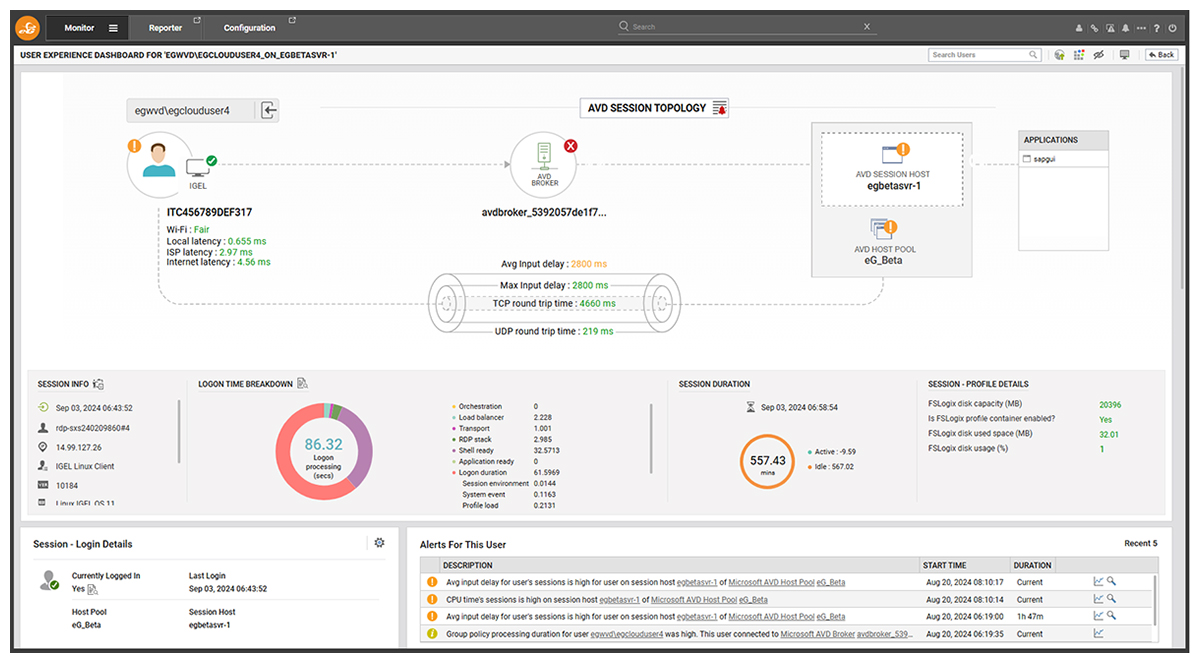
5. Do You Have the Ability to Provide Your Helpdesk with Simple, Consistent Views So They Can Triage Problems Quickly?
A critical, and often overlooked, aspect of an AVD monitoring strategy is ensuring that your helpdesk team has the tools and information they need to support users effectively. This involves providing simple, consistent views of the AVD environment that help them quickly identify and triage issues. AVD helpdesk monitoring dashboards should offer a clear overview of key performance indicators (KPIs) and alert statuses, allowing the team to address problems before they escalate.
By integrating user-friendly dashboards and automated alerting systems into your AVD monitoring solution, you empower your helpdesk to be more proactive and efficient. This not only improves the overall user experience but also reduces the time and effort spent on troubleshooting and problem resolution.
A good AVD monitoring strategy will embrace features beneficial to helpdesks, specific features such as:
- Maintenance modes: whereby AVD administrators can put parts of the deployment into maintenance and avoid triggering alerts to helpdesks
- Stakeholder specific views and functionality: whereby helpdesk staff are limited by RBAC to only see details relevant to their roles. This is important in organizations with high security requirements.
- ITSM integrations: whereby AVD alerts and support tickets are integrated into tools used in the wider organization such as ServiceNow, Jira, MS Teams, and so on.
Learn more about monitoring strategies and features that can help the helpdesks in the article – Empowering IT Help Desks with IT Service Monitoring (eginnovations.com).
Conclusion for an Effective AVD Monitoring Strategy
Developing a comprehensive AVD monitoring strategy is essential for maintaining the performance, security, and reliability of your Azure Virtual Desktop environment. By asking these five critical questions—covering everything from real-time monitoring to user experience and helpdesk support—you can ensure that your strategy addresses all key aspects of AVD management.
Whether you are focused on AVD performance monitoring, AVD security monitoring, or optimizing the user experience, a well-rounded strategy will help you achieve the operational excellence needed to support your organization’s digital workspaces for years to come. Investing in robust monitoring tools, observability practices and AIOps-driven automation now, will pay dividends in the form of improved user satisfaction, reduced downtime, and greater overall efficiency.
eG Enterprise is an Observability solution for Modern IT. Monitor digital workspaces,
web applications, SaaS services, cloud and containers from a single pane of glass.
 Geert joined eG Innovations in 2023 with the expansion of our Benelux team via a dedicated Belux presence in addition to our Benelux HQ team in Den Haag, NL. Many in the region already know Geert via his significant experience in sales and account management for Dell, Citrix and Cisco – working with enterprise customers and healthcare providers. Geert is based out of Edegem in Belgium.