The Azure Well-Architected Framework for Azure Virtual Desktop Workloads details certain key considerations that you should include when architecting the monitoring of your AVD workloads and deployments. These key considerations are:
- Health and availability monitoring
- Performance monitoring
- Security monitoring
- Reporting
- Alerting
Whilst native tools are provided, to meet the criteria of the Azure Well-Architected Framework, significant configuration is needed to leverage Azure Monitor. Monitoring AVD requires you to configure at least one Log Analytics workspace. But beyond this you will also need to enable data collection for the following items of your Log Analytics workspace:
- Diagnostics from your Azure Virtual Desktop environment
- Recommended performance counters from your Azure Virtual Desktop session hosts
- Recommended Windows event logs from your Azure Virtual Desktop session hosts
And beyond this you will probably need to set up a bunch of stuff such as:
- Azure Virtual Desktop Insights
- Some mechanism to ensure monitoring agents are installed
Why Native Azure Tools Don’t Suit Some Organizations for Monitoring AVD Workloads
Many of our customers have chosen to avoid the complexity and effort of setting up Azure native monitoring by using eG Enterprise for a wide range of reasons and factors, these include:
- The organization has long-term hybrid cloud and / or cloud agnostic strategies. Increasingly organizations have formal cloud exit strategies which require workloads and monitoring tooling to be portable to other clouds or back on-prem, see: The Importance of a Cloud Exit Strategy: What It Is, Who Needs It, and How to Plan It | eG Innovations. Investing in Azure only tooling, for monitoring AVD, doesn’t fit with such strategies. Being able to monitor before and after migrations and / or exits is a fundamental need.
- Where AVD is used alongside other DaaS and VDI technologies such as Citrix / VMware or AWS technologies, for surge capacity. Many organizations spin up AVD desktops and apps to support short term or contract projects. Other organizations use them to support seasonal surges such as term times in universities or “Black Friday” type events impacting retail call centers. Aside from automating spinning up day-zero monitoring alongside AVD, eG Enterprise allows orgs to monitor all of their apps and desktops in a single pane of glass – i.e. Citrix alongside VMware, AVD or whatever.
- In-house AVD skills (or a lack thereof!). AVD is a relatively new and rapidly changing technology. Not only does it take considerable manual effort to setup and maintain Azure native monitoring – it requires considerable experience and skills to do it well and cost-effectively. Such experts are hard to find!

9 Qualities of eG Enterprise to Help You Meet the Azure Well-Architected Framework Monitoring Criteria Out-of-the-Box
Quality 1: Auto-deploy, Auto-discovery and Topology Mapping
The AIOps-powered auto-deploy and auto-discovery capabilities within eG Enterprise automatically identify and map resources, devices, applications, and services within IT infrastructures. Domain-aware AIOps allow dependencies between tiers and components to be discovered. In the context of AVD this means that beyond session hosts, key components that are involved in the end user experience such as Entra ID, the AVD broker, Azure Storage and Networking and so on are discovered.
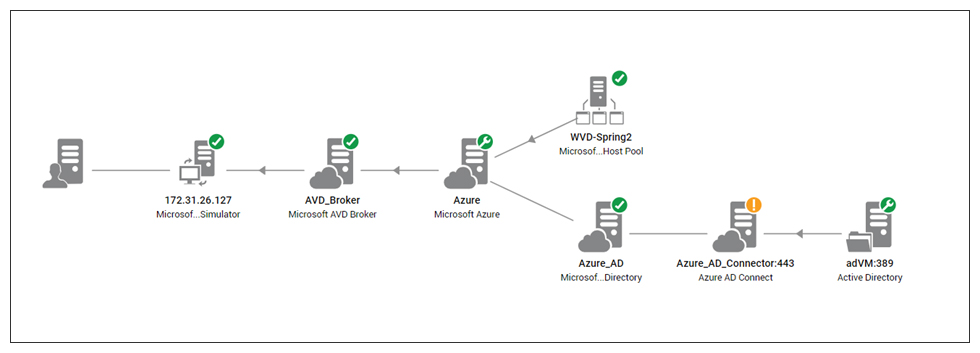
eG Enterprise is simple to implement and easily integrated with Nerdio Manager and other automation tooling, scripts and IaC (Infrastructure-as-Code) workflows.
Quality 2: Observability for Health and Availability Monitoring
Microsoft recommends that you leverage Azure services such as Azure Service Health and Azure Resource Health to keep you informed about your cloud resources’ health.
They recommend you manually or otherwise configure alerting the Service Health service, details on how to do this are available, here: Set up service alerts.
They also recommend you do similar on the Resource Health service and in particular monitor:
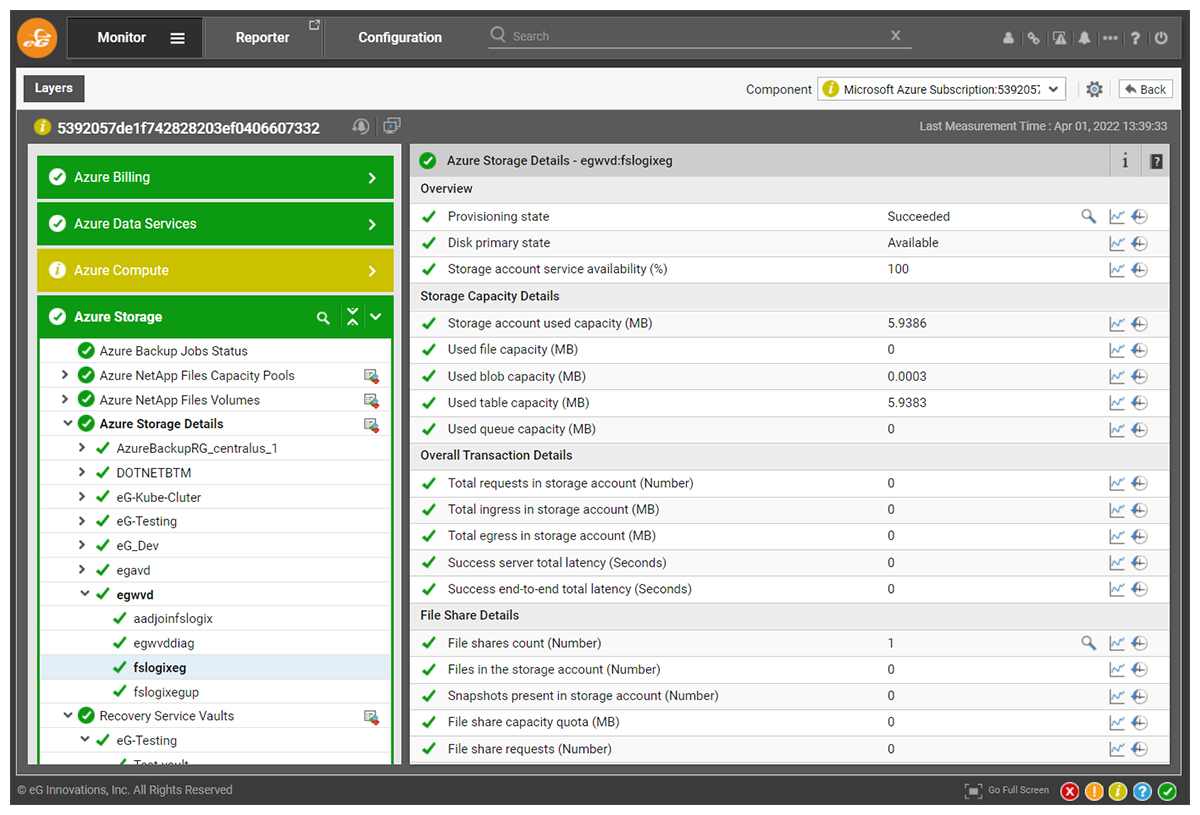
- Azure Storage solutions for Azure Virtual Desktop FSLogix and App Attach
- Session hosts, or virtual machines (VMs)
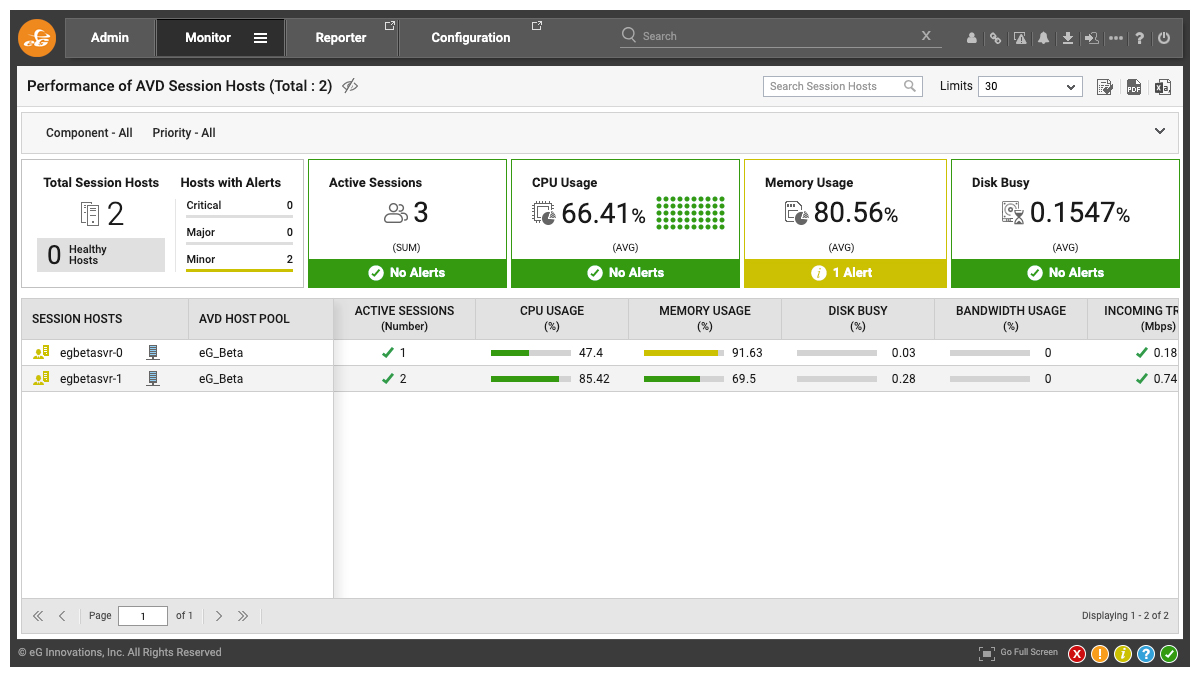
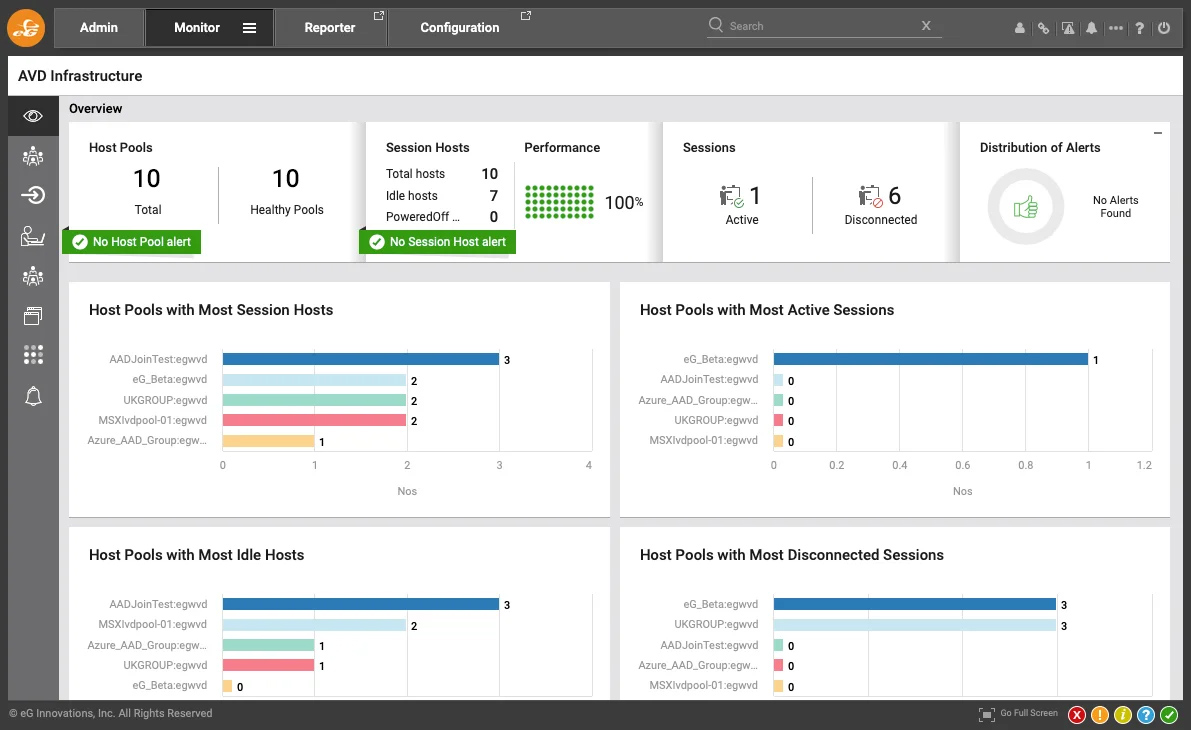
With eG Enterprise you get all this and more, out-of-the-box with no fiddly configuration or metric threshold calculations – just end-to-end visibility into the performance of your Azure Virtual Desktops. You can monitor the entire AVD service delivery chain: Azure subscription, Azure AD, Azure Host Pools, brokering, session hosts, FSLogix profiles, Azure storage and more. Learn more from our solution pages and briefs, see: Azure Virtual Desktop Monitoring | eG Innovations and avd-monitoring.pdf (eginnovations.com).
Quality 3: Performance Monitoring
The framework also advises that you retrieve key performance indicators and necessary logs from your Azure Virtual Desktop entities, configure the following diagnostics data to be sent to Log Analytics:
- Azure Virtual Desktop host pool logs
- Azure Virtual Desktop workspace diagnostics
- Azure Virtual Desktop application group diagnostics
- Storage diagnostics
- Data about session hosts from a Monitor agent or Log Analytics agent
- Performance and event log data that’s collected according to Monitor or Log Analytics agent data collection rules
- Azure VM insights data
Details of how to configure an AVD deployment to achieve this using native tools are covered, here: Monitoring considerations for Azure Virtual Desktop workloads – Microsoft Azure Well-Architected Framework | Microsoft Learn. Again, these are fairly complex and lengthy. Beyond metric and log collection, there is another section on deployment configuration and templates – covers ARM templates, BICEP, Terraform and agent deployments / agent extensions. Avoiding this complexity and overhead is precisely the reason that many of our customers choose to use eG Enterprise as a turnkey, ready-to-go, simple single-pane-of-glass GUI alternative.
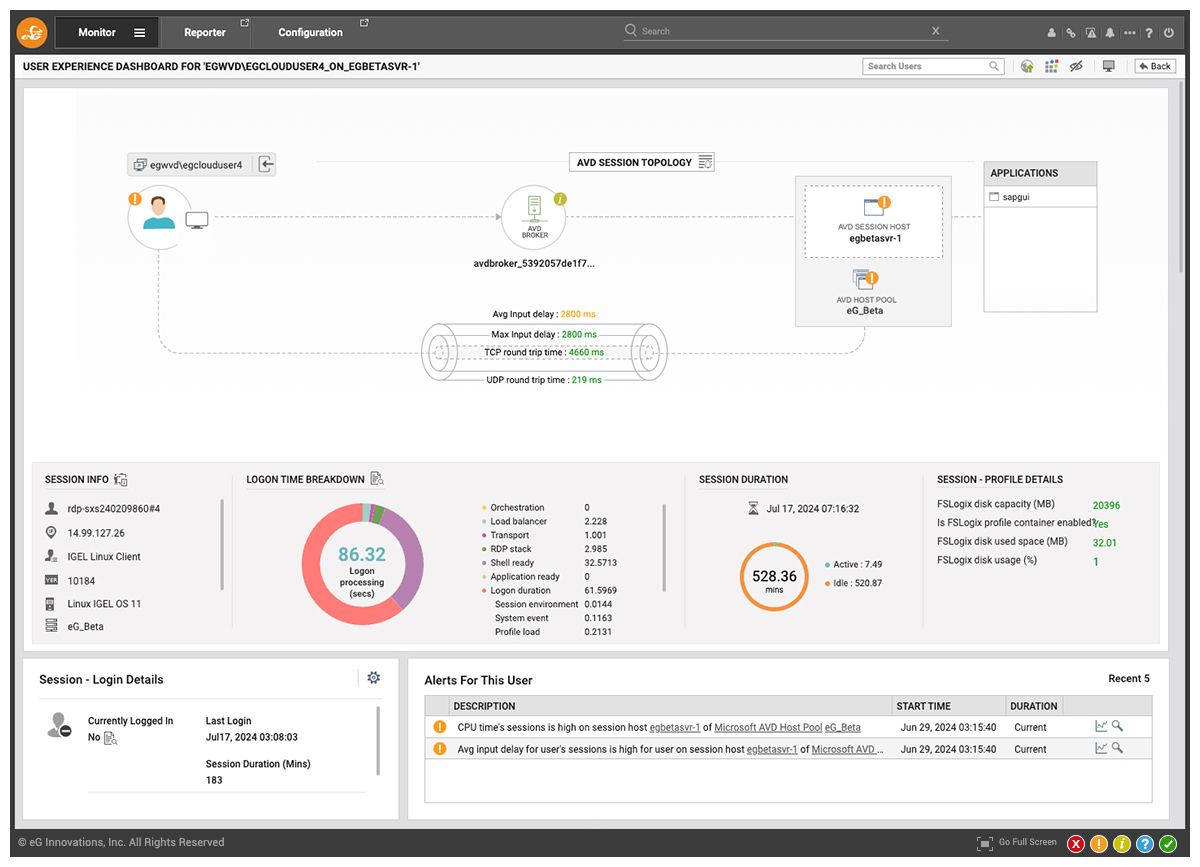
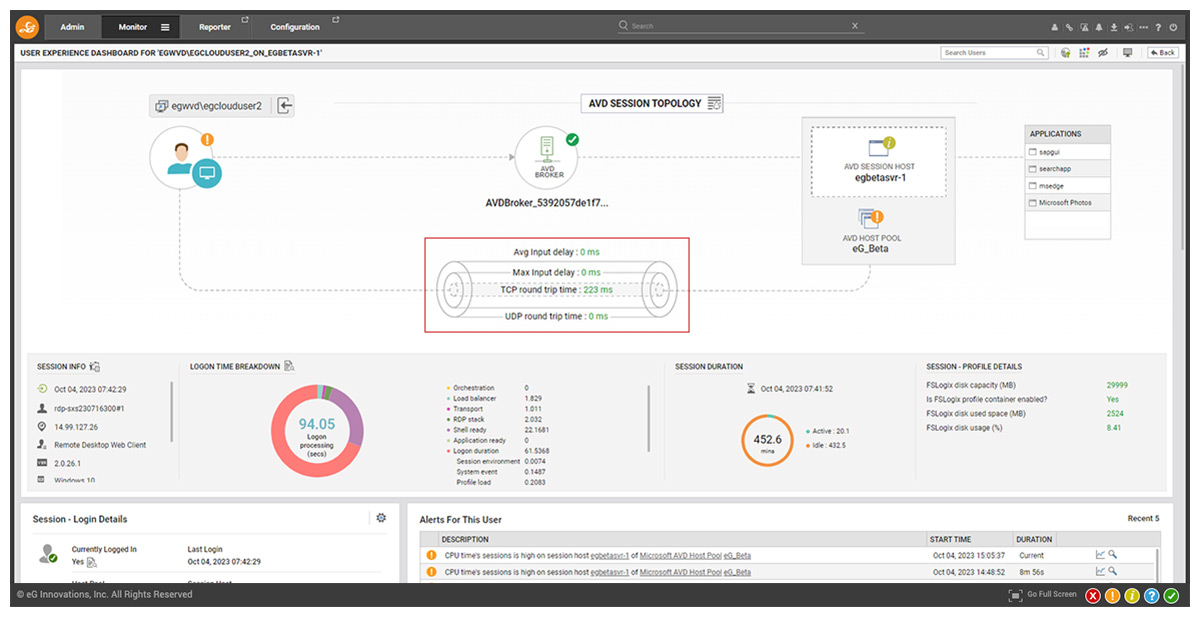
Our AVD users, can monitor and optimize user experience and application performance out-of-the-box, see:
- Troubleshooting Azure Virtual Desktop (AVD) Sessions – Key User Experience and Graphics Metrics to Monitor | eG Innovations and
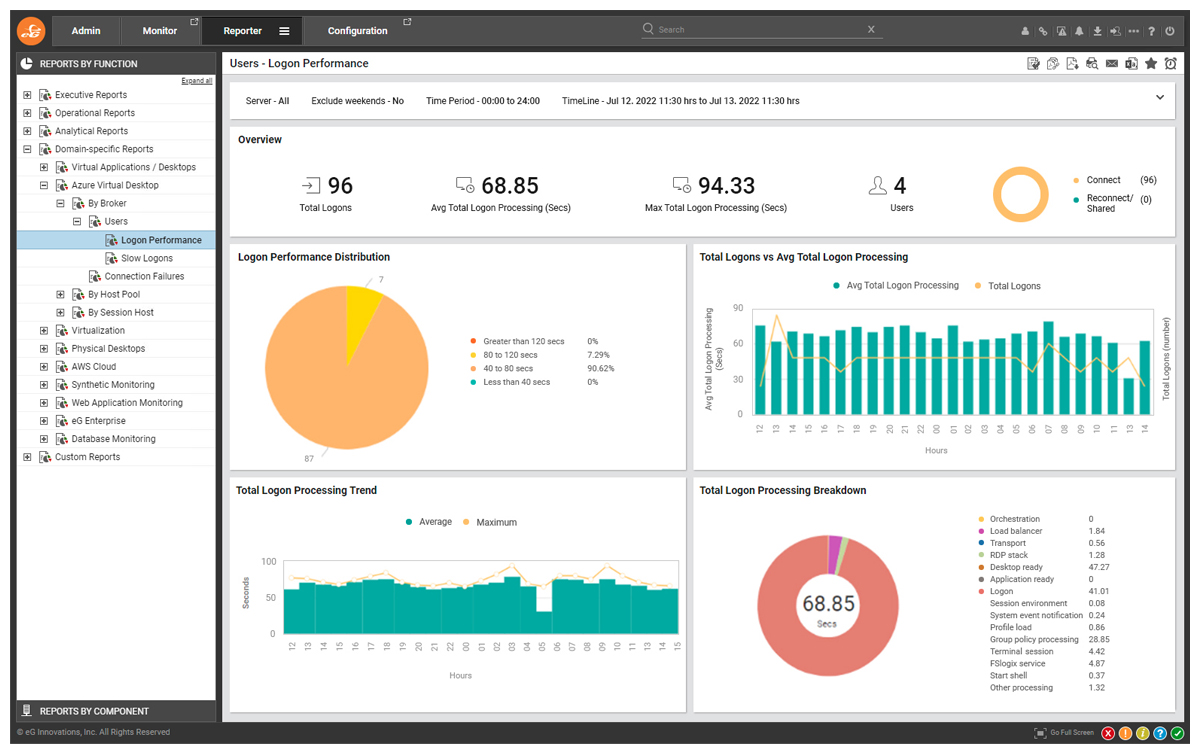
- Troubleshooting Azure Virtual Desktop (AVD) Issues through Logon and Beyond | eG Innovations.
Quality 4: Security – Microsoft Entra ID Authentication and Audit Logs Monitoring
Microsoft Entra ID (was Azure Active Directory (Azure AD)) is the first-line authentication solution for Azure Virtual Desktop no matter which connection method a client uses. As a result, it’s important to collect Microsoft Entra ID authentication and audit logs. Using native Azure tools you can do this in a few ways:
- In your diagnostics settings, configure audit logs and sign-in logs to be sent to Log Analytics, where the data can be queried and alerted on.
- Use a connector in Microsoft Sentinel (an additional pay for service) to collect data from Microsoft Entra ID and stream it into Microsoft Sentinel.
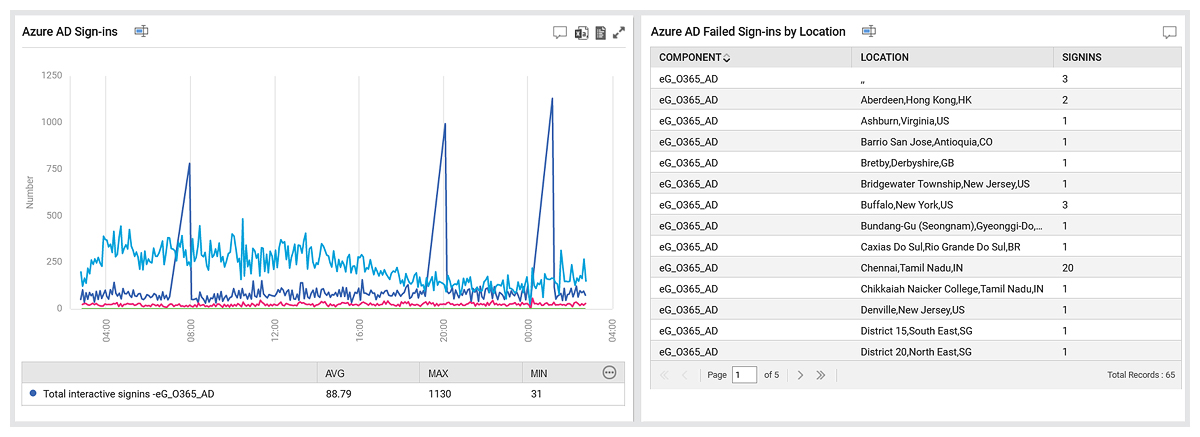
eG Enterprise automatically proactively monitors and alerts on Entra ID issues and monitors all the relevant metrics, events and logs that might impact your AVD and Azure landscape. My colleague Babu Sundaram has written widely, showcasing our support for Entra ID / Azure AD, see:
- Monitoring Azure Active Directory Users | eG Innovations
- Azure AD Monitoring – Sign In Logs & Attack Detection (eginnovations.com)
- Monitoring Azure AD Audit Logs | eG Innovations
- Azure AD Application Registration Monitoring Tips (eginnovations.com)
Quality 5: Security Event Log Monitoring for AVD Workloads
The Well-Architected Framework states that you should collect security event logs from your Azure Virtual Desktop session hosts and advises you to add these logs to a centralized repository for security events that involve your Azure Virtual Desktop hosts. To do this using native tools Microsoft advises that you use a Monitor agent data collection rule for collecting security event logs. You will then need to put in place a mechanism to query those logs as required.
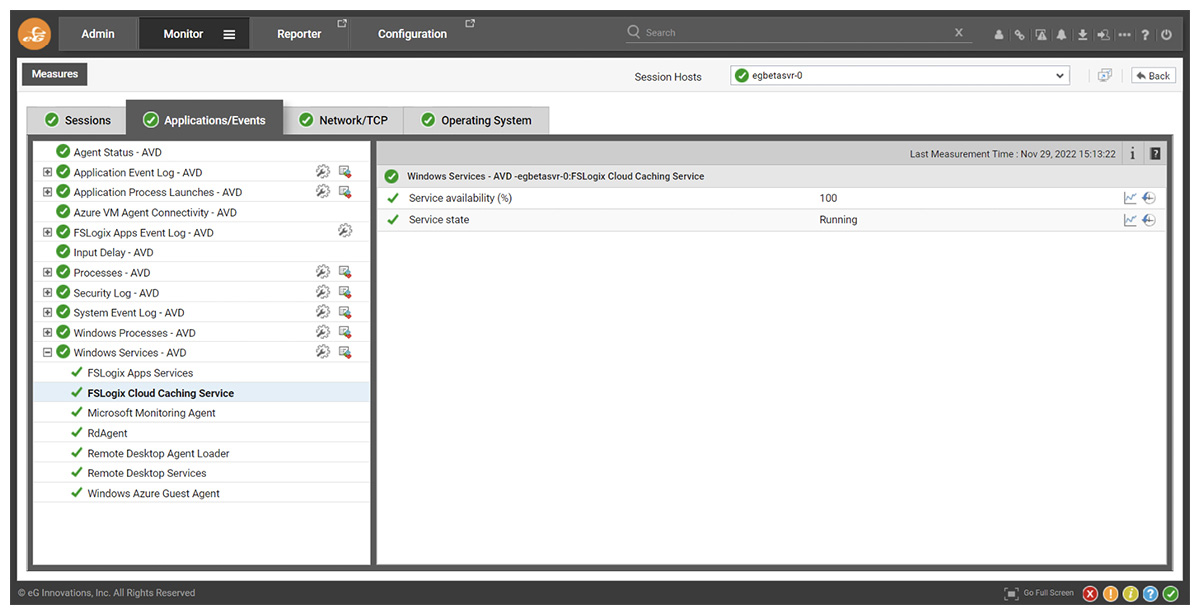
Out-of-the-box eG Enterprise proactively and continuously monitors logs including:
- Windows event logs (including and beyond those pertaining to security), see: What is Windows Event Log? | eG Innovations.
- Logs associated with dependent components critical to authentication and logon such as Azure AD Sign-in Logs, see: Azure AD Monitoring – Sign In Logs & Attack Detection (eginnovations.com).
Quality 6: Out-of-the-box Alerts and Root-cause Observability Diagnostics
The Azure Well-Architected Framework recommends that you leverage the Azure Monitor alert framework or an equivalent or comparable functionality. They recommend you configure custom alerts for the following types of Azure Virtual Desktop events, diagnostics, and resources:
- VM performance
- Critical events, such as application events with IDs 3702 or 3703 for unavailable-state problems on session hosts
- Service Health
- Resource Health
- Azure Virtual Desktop diagnostic data
- Profile and App Attach packages
- Defender for Cloud
If using Azure Monitor, you will need to do this manually or via implementing some sort of automation or scripting in addition to the Azure native tooling.
One of eG Enterprise’s strengths is its extremely strong AIOps-powered alerting. Domain-aware of Azure, AVD and other components, alerting is configured out-of-the-box and includes features beyond Azure Monitor alerting to automatically set thresholds, reduce false positives and eliminate manual tuning. Alerting is critical for reducing MTTR, so we’ve released a comprehensive whitepaper on assessing this area of functionality, see: White Paper | Make IT Service Monitoring Simple & Proactive with AIOps Powered Intelligent Thresholding & Alerting (eginnovations.com).
Alerting in native Azure Monitor does not allow you to combine static and dynamic thresholds currently, eG Enterprise does – a strategy that helps avoid alarm storms or false positives, see: Static vs Dynamic Alert Thresholds for Monitoring | eG Innovations. ITSM integrations within eG Enterprise allow you to easily track Azure and AVD issues within the de facto ISTM or ticketing system used by your organization, see: Integration with multiple ITSM tools at the same time (eginnovations.com).
For more details on monitoring the end-to-end AVD user experience for users accessing applications, you might like to explore these articles:
- Troubleshooting Azure Virtual Desktop (AVD) Issues through Logon and Beyond | eG Innovations
- Troubleshooting Azure Virtual Desktop (AVD) Sessions – Key User Experience and Graphics Metrics to Monitor | eG Innovations
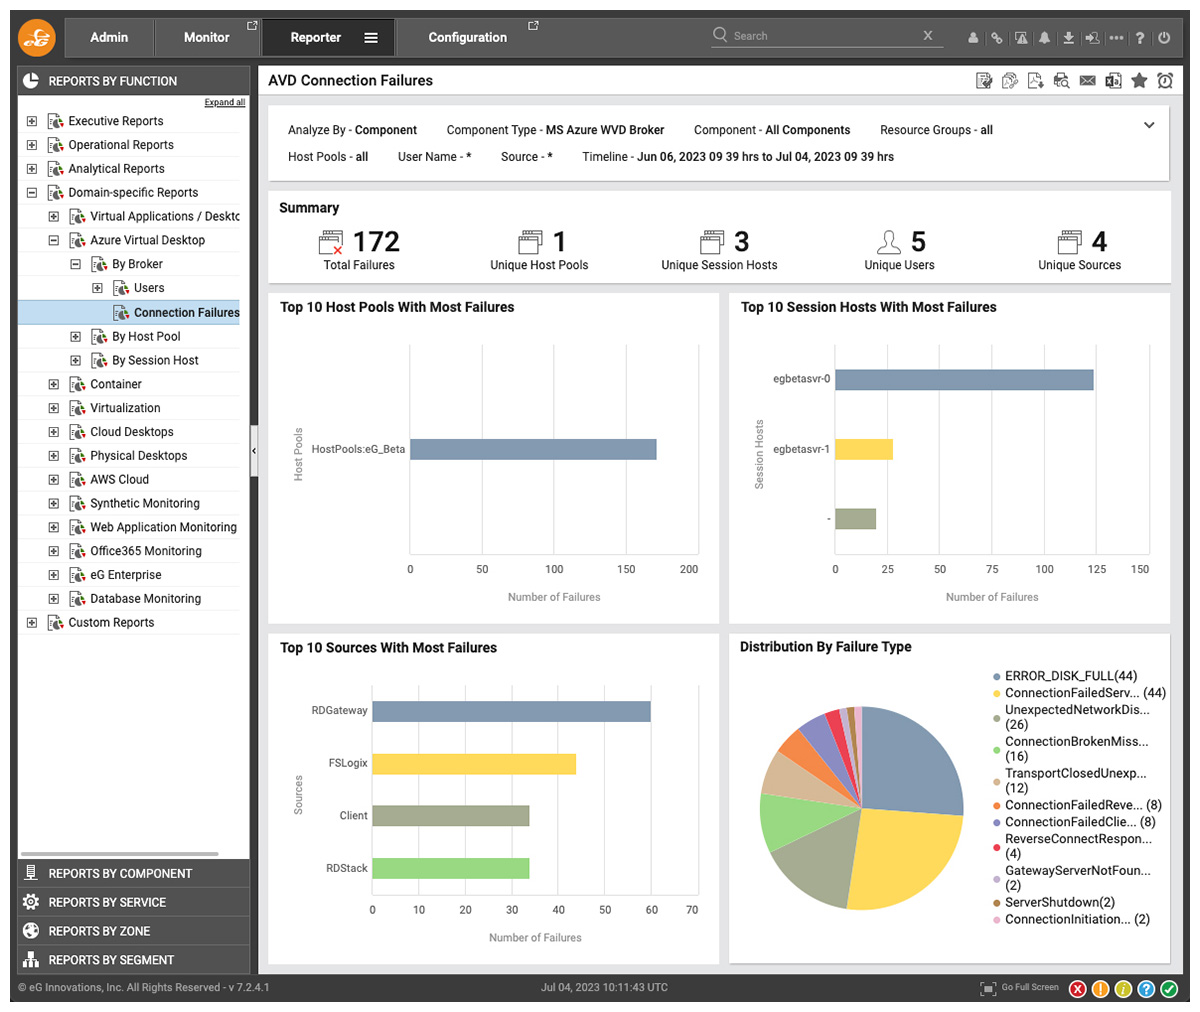
- Troubleshooting AVD (Azure Virtual Desktop) Connection Failures: A Comprehensive Guide | eG Innovations
Beyond Alerting – Root-cause Diagnostics for Observability
Beyond alerting, which will tell you that something is wrong. The eG Enterprise AIOps engine correlates alarms and the signals of potential issues and performs additional diagnostic tests if needed. This information is used to differentiate primary root-cause alarms (for example, a host availability failure due to a DNS issue) from secondary symptom alarms (100 user experience alerts caused by the host failure). Where possible detailed diagnostics are supplied identifying the root cause, remedial suggestions are made, and automatic remediation performed.
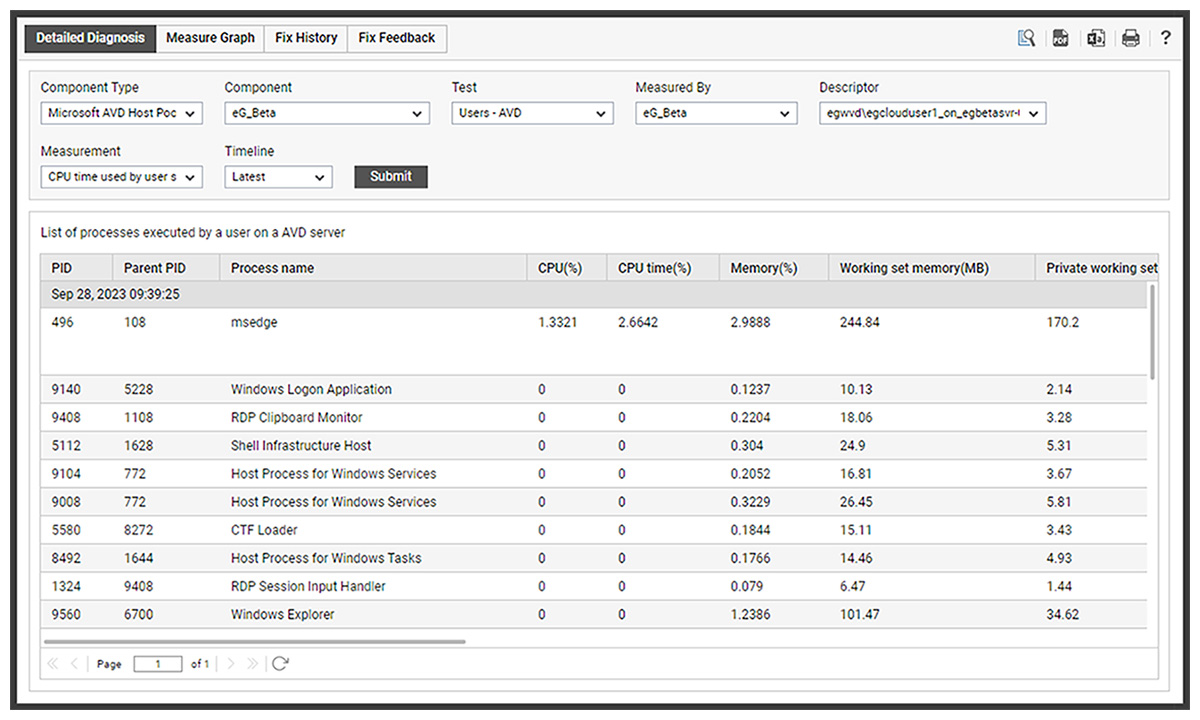
Root-cause Diagnostics for AVD – An Example
The CPU time used by user sessions (%) indicates the percentage of time, across all processors, that a user used the CPU. In contrast, the CPU usage for a user’s processes measure indicates the percentage of overall CPU time that a user is using. For example, if a user is taking up one of the CPUs for 100% of the time and there are 8 CPUs on the AVD, CPU usage for user’s processes will be 12.5% (100/800). While 12.5% may seem to be a low number, the fact that the user is taking up one of the CPUs of the AVD is significant.
Hence, CPU time used by user’s session measure is a better indicator of CPU usage by users. In the above example, since the user is consuming 100% of one processor, CPU time used by user’s session will be 100%. A high value of this measure or a consistent increase in the value of this measure demands attention. Use the detailed diagnosis to know what CPU intensive activities are being performed by the user.

Quality 7: Pre-packaged Reports and Dashboards for AVD
To meet the Azure Well-architected Framework criteria, organizations are recommended (see: Reporting – Monitoring considerations for Azure Virtual Desktop workloads – Microsoft Azure Well-Architected Framework | Microsoft Learn) to
- Activate and use the Azure Virtual Desktop Insights Dashboard
- Create their own reports or workbooks by using Log Analytics tables and Azure Resource Graph query results as data sources. Resource Graph is a service that can be used to report on Azure Virtual Desktop objects such as host pools, workspaces, compute components, and storage solutions.
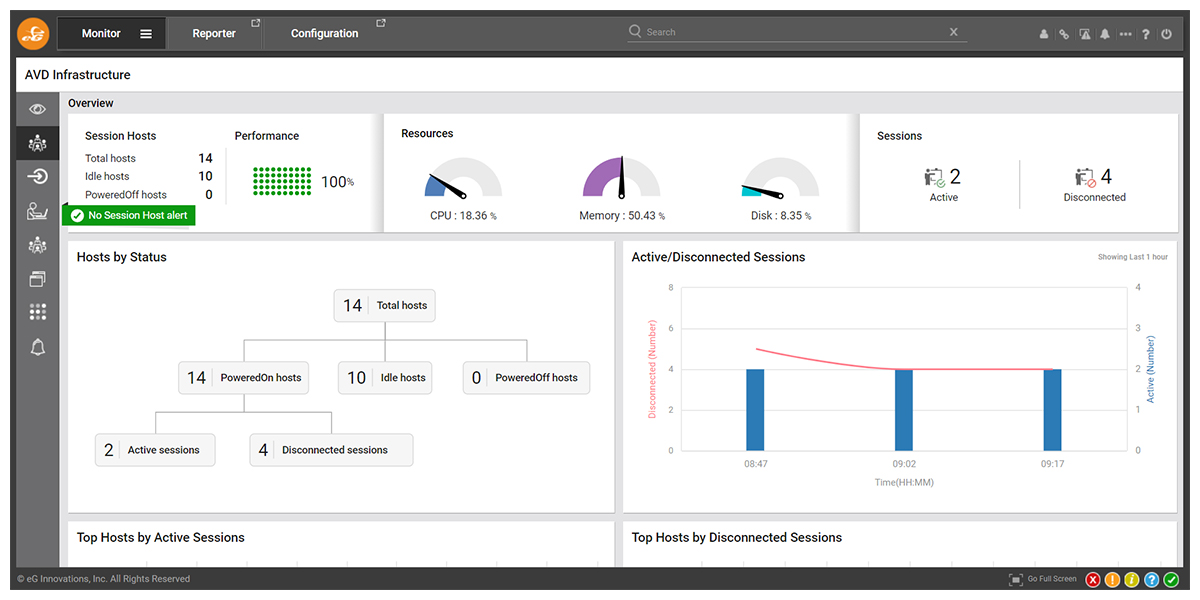
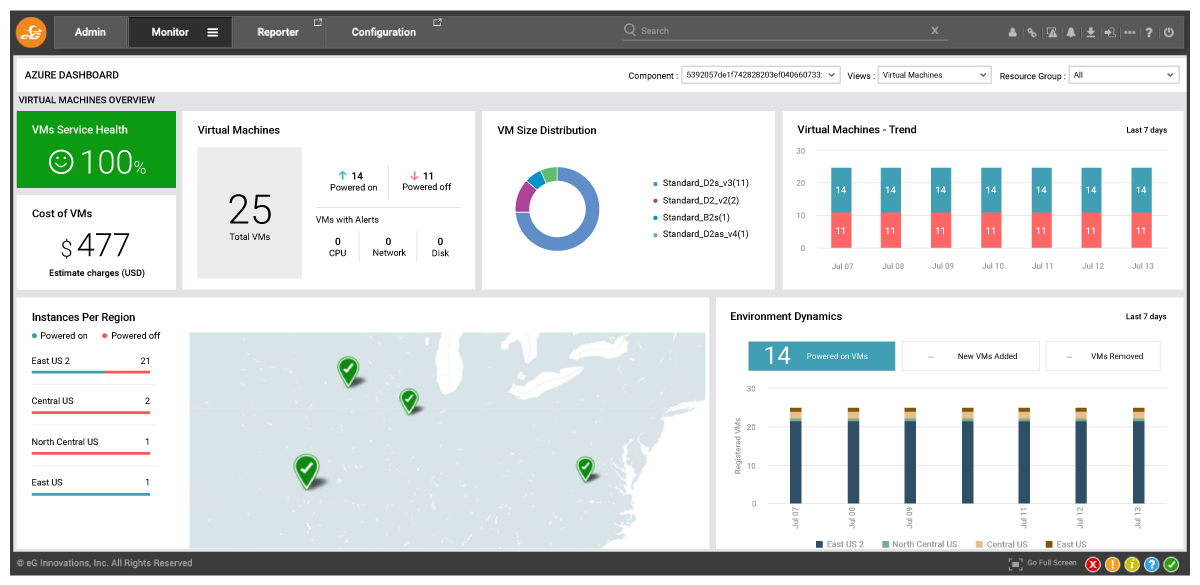
With eG Enterprise you don’t get one dashboard but dozens and dozens, including many tailored for different personas and roles within an organization beyond the IT administrator, for example for L1/L2 frontline Helpdesk operators, or MSPs assessing SLA / KPI compliance. Many are showcased in my other blogs, see: Babu Sundaram, Author at eG Innovations, some AVD User Experience dashboards are shown in: Troubleshooting Azure Virtual Desktop (AVD) Sessions – Key User Experience and Graphics Metrics to Monitor | eG Innovations. A simple GUI WYSIWYG dashboard builder is provided for organization with bespoke needs.
Similarly, numerous ready-made reports are supplied for AVD reporting, these can be customized or custom reports added as needed via a simple GUI report builder.

Quality 8: Alerts
I’ve added this section for completeness and so that the reader can directly compare the manual configuration steps detailed in Monitoring considerations for Azure Virtual Desktop workloads – Microsoft Azure Well-Architected Framework | Microsoft Learn.
eG Enterprise’s alerting is again out-of-the-box. Moreover though, eG Enterprise’s AIOps engine provides significantly enhanced alert correlation above native tooling to avoid alert storms when monitoring AVD workloads. eG Enterprise also overcomes some fundamental limitations in Azure Monitor alerting. For the complete story, please see:
- Static vs Dynamic Alert Thresholds for Monitoring | eG Innovations
- or White Paper | Make IT Service Monitoring Simple & Proactive with AIOps Powered Intelligent Thresholding & Alerting (eginnovations.com).
Quality 9: Cost-effective Monitoring for AVD Workloads and Azure Infrastructures
The Azure Well-Architected Framework for Azure contains many configuration recommendations for metrics to collect and mechanism to use. The framework is however extremely lightweight on details of which metrics and frequency of collection. Monitoring in Azure can get very expensive and is complex to budget for. eG Enterprise can dramatically decrease costs over native Azure monitoring, enabling predictable budgeting and accounting.
If you want to understand for yourself the issues around the costs of Azure Log Analytics, Monitor and Insights for AVD, we’ve previously written some detailed articles, please see: How to Reduce Azure Log Analytics Costs | eG Innovations and Reduce Azure costs by finding unused and wasted resources (eginnovations.com).
Conclusions on Monitoring AVD Workloads
Microsoft’s Azure Well-Architected Framework for Azure Virtual Desktop (AVD) workloads makes it clear that monitoring is essential functionality. However, if you are one of the many organizations who’d find it challenging to adopt. Please do consider contacting us or arranging a demo to see how eG Enterprise can take away those pain points.
eG Enterprise is an Observability solution for Modern IT. Monitor digital workspaces,
web applications, SaaS services, cloud and containers from a single pane of glass.
Further Information
- See our AVD solution pages: Azure Virtual Desktop Monitoring | eG Innovations
- For more information on AVD Monitoring tailored to MSP use cases, please see: AVD Monitoring for MSPs (Managed Service Providers) | eG Innovations.
- Watch a quick video on eG Enterprise support for monitoring AVD workloads: Azure Virtual Desktop Monitoring (AVD Monitoring) with eG Enterprise (youtube.com).
- For information on AVD adoption, see: AVD – Azure Virtual Desktop – Usage Trends and Statistics | eG Innovations.
- Quick 2-page Solution Brief for eG Enterprise for AVD: Azure Virtual Desktop Monitoring – Solution Brief (eginnovations.com)
- How to Reduce Azure Log Analytics Costs | eG Innovations
 Rachel has worked as developer, product manager and marketing manager at Cloud, EUC, application and hardware vendors such as Citrix, IBM, NVIDIA and Siemens PLM. Rachel now works on technical content and engineering and partner liaison for eG Enterprise