When it comes to Citrix Cloud monitoring best practices there are a number of factors to consider. You have to take a different approach to monitoring Citrix Cloud compared to Citrix that is deployed on-premises so the best practices will also differ.
About Citrix Cloud
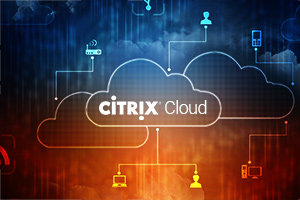 The evolution of cloud computing has transformed all aspects of the IT landscape – how applications are deployed, how data is consumed and stored, how security is managed, and so on. A recent Forbes survey reports that in the span of 15 months, about 80% of all IT funds will be committed to cloud solutions. Cloud adoption has also started in the end-user computing (EUC) world. From Citrix’s latest financial update, we can see that Citrix Cloud accounts for over 10% of their annual revenue and is growing at over 40% year on year.
62% of organizations are using virtual desktops or virtualized applications in the cloud, with Microsoft AVD being the most popular, followed by Citrix Cloud.
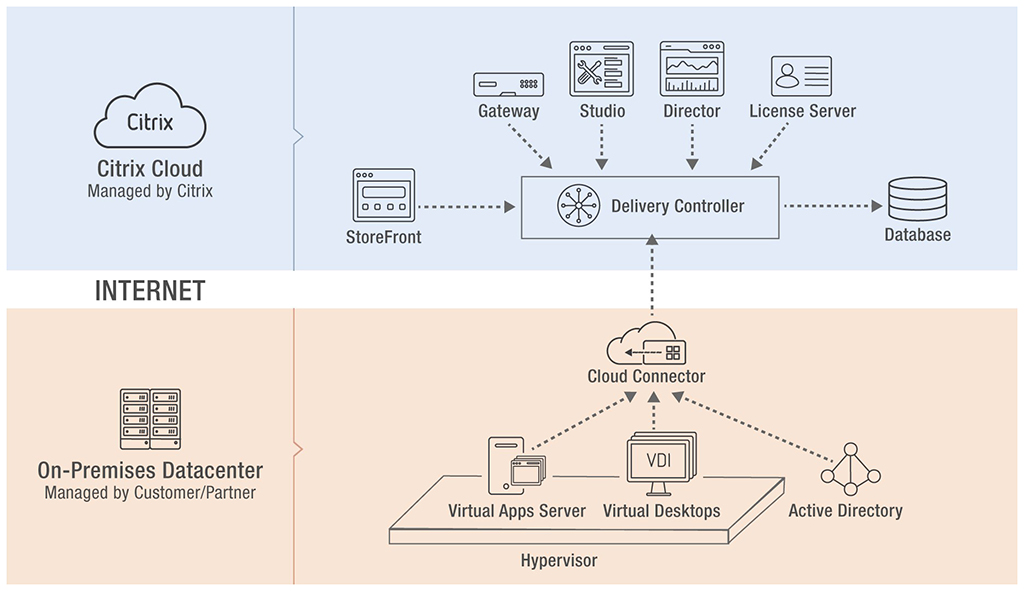
Citrix Cloud services offer a simple, fast, and flexible way of delivering digital workspaces. These are rendered as hybrid cloud services where Citrix provides cloud-based management while customers decide where workloads are located. In the hybrid deployment model, Citrix implements and manages the Citrix Delivery Controller, StoreFront, ADC Gateway, SQL Server, License Server, etc. This is called the Citrix Control Plane. On the other hand, the Citrix customer or service provider is required to implement the Virtual Apps and Desktop VDAs in their datacenters (or private/public cloud). The Citrix components in the datacenter are referred to as the Resource Plane. To enable connectivity between these two planes, one or more Citrix Cloud Connectors need to be installed (usually installed in pairs for HA) and managed in the resource plane.
The Performance Monitoring Challenge: On-prem vs. Citrix Cloud
Monitoring the performance of Citrix Cloud services is challenging for several reasons:
- The Citrix Cloud architecture is distributed and involves several domains of control. There may be multiple administrators responsible for elements in the Resource Plane. The Control Plane is hosted and managed by Citrix, and organizations do not have visibility into its operation and performance.
- Some organizations may deploy the Resource Plane in a public cloud – AWS, Azure, etc. Performance of the public cloud can also affect the user experience.
- Network connectivity between the Resource Plane and Control Plane is also important. Slowness in the inter-connecting network will affect the quality of Citrix services.
- At the same time, end users are not aware of or interested in knowing the complexity of the Citrix Cloud architecture. They will still expect the performance of Citrix services to be on-par with that of physical apps and desktops.
Therefore, performance monitoring of Citrix Cloud is challenging, and when users complain about slowness, Citrix administrators have to be able to determine what is causing the problem – is it to do with the Citrix Resource Plane and its components, or the public cloud, or the Citrix Control Plane, or the network interconnecting the resource and control planes?
Requirements for Citrix Cloud Monitoring
From the above analysis, it is clear that the built-in tools from Citrix are not sufficient for monitoring Citrix Cloud environments effectively. Organizations deploying Citrix Cloud need to be able to:
 Measure the user experience of virtual apps/desktops sessions. The success of any digital workspace deployment is dependent on the user experience it offers. Since part of the delivery infrastructure is not within their control, it is even more important than before that organizations deploying Citrix Cloud have ways to continuously and proactively monitor user experience. This way, administrators can learn about problems before your users do and can work to address these problems quickly.
 When problems will invariably occur, they need to be able to determine the location of the root-cause of the problem. A requirement for accurate root-cause diagnosis is the ability to monitor every layer and every tier of the infrastructure. Since problems can originate in any place of the service delivery infrastructure and affect the user experience, monitoring should cover the on-premises Citrix infrastructure, the datacenter elements supporting the Citrix tiers, the network interconnecting the datacenter to the cloud and the Citrix Cloud Control plane.
 To justify the investment in Citrix Cloud, management will also need information on the usage of virtual apps and desktop services and will also seek ways to optimize the costs associated with these services through infrastructure right-sizing, optimization strategies and better capacity planning.
Built-in Tools from Citrix: Do They Suffice for Citrix Cloud Monitoring?
There are several tools available for monitoring the availability and performance of Citrix Cloud services:
- Citrix admins can check the Citrix Cloud portal – status.cloud.com. Citrix posts updates if they have known problems that are impacting their cloud services. Typically, only significant outages that are affecting many customers are reported here.
- Citrix’s SLA for Citrix Cloud is based only on availability. So, if there are performance issues, they are mostly attended to reactively. Often customers must report issues to have them investigated.
- As part of your Citrix Cloud subscription, you have access to Citrix Director in the cloud. This gives you insights into session usage, activity, logon times, and such. But you don’t get end-to-end insights to troubleshoot the cause of slowness – i.e., whether it is in your infrastructure, with a hypervisor or storage, with your PVS server, or with your network connectivity to the cloud, or in the cloud.
- Finally, Citrix has just introduced Performance Analytics. This is mainly a way to easily interpret aggregate metrics collected by Citrix Director into a single metric that indicates if your users are happy or not. Analytics does not provide you any additional insights for troubleshooting performance issues. Plus, this is a paid tool that must be purchased additionally.
| status.cloud.com | Citrix Director | Citrix Analytics |
|
|
|
In summary, the built-in Citrix monitoring tools fail to help you with monitoring best practices because they:
- Lack the ability to monitor user experience end to end
- Do not provide monitoring to all the Citrix and non-Citrix tiers of the Citrix Cloud service delivery chain
- Force organizations to use several monitoring tools to troubleshoot performance issues
- Do not provide the analytics that organizations need to right-size, optimize and plan their Citrix Cloud deployment
eG Enterprise: Enabling Four Best Practices for Citrix Cloud Monitoring
eG Enterprise addresses the performance monitoring needs of organizations that are deploying Citrix Cloud. Using eG Enterprise organizations can follow the Citrix Cloud monitoring best practices:
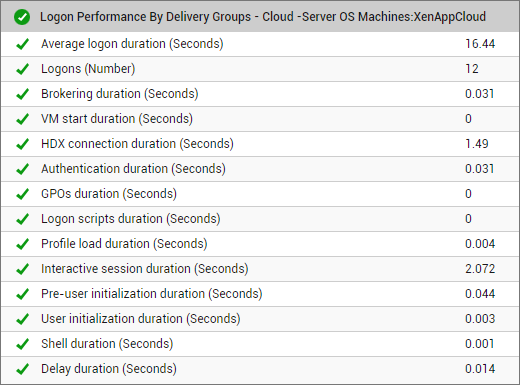
- Measure the user experience of virtual apps/desktop service delivery: As with any cloud service, synthetic monitoring is important as it touches every tier of the service delivery chain. eG Enterprise has built-in synthetic monitoring tools to simulate user logons, application launch and application access in virtual apps/desktop sessions. Simulations can be set up from multiple locations to understand performance from each location. At the same time, through integration with Citrix Cloud APIs and using agents deployed in the Resource Plane, eG Enterprise collects real user experience data. Every user logon to the Citrix site, every application launch and the latencies seen by every user session are tracked, so administrators can be alerted to performance anomalies in advance.
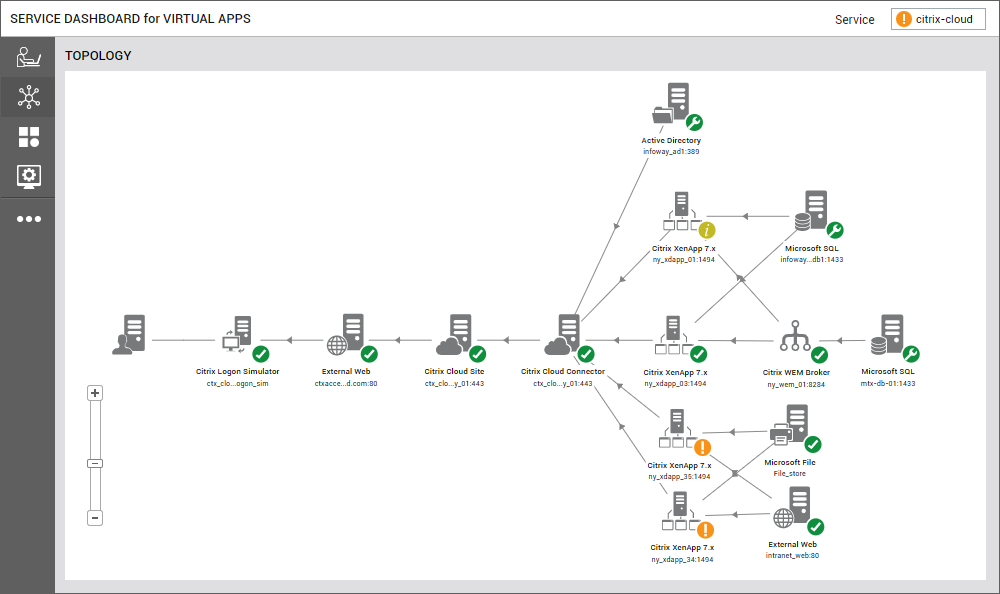
- Monitor every layer and every tier of the hybrid Citrix cloud infrastructure: Once you know that there is a performance issue, the immediate next question is what is causing it. And because of the distributed nature of the Citrix Cloud environment, Citrix admins need visibility of all components of the Citrix delivery stream – from the Control Plane to the Resource Plane and the Cloud Connectors in between. With eG Enterprise, Citrix admins get a single pane of glass to monitor all aspects of the Control Plane and the Resource Plane, as well as any public cloud infrastructure used and the interconnecting network’s performance.
- Isolate the root cause of performance problems: When you get data from all the tiers, you will need help determining where the root cause of the problem is. By understanding the dependencies between tiers — i.e. between the Virtual Apps server and the underlying virtual machine and host, between the Cloud Delivery Controller and the Cloud Connector and so on — you will be able to pinpoint the potential root cause of performance bottlenecks. Using intuitive topology maps, eG Enterprise allows administrators to visualize interdependencies easily between the Control Plane, the Cloud Connector, components in the resource plane, and the supporting on-premises/cloud infrastructure for root cause diagnosis. An automatic root-cause diagnosis engine automatically analyzes performance anomalies in each tier and uses the dependency map to determine where the root-cause of a problem lies.
eG Enterprise is an Observability solution for Modern IT. Monitor digital workspaces,
web applications, SaaS services, cloud and containers from a single pane of glass.
- Get insights for performance optimization and cloud migration: Historical insight plays a vital role in performance management. There is lot to learn from data – trends, patterns, anomalies, bottlenecks, and so on. eG Enterprise provides Citrix admins the historical reports that provide actionable insight to optimize capacity on their Virtual Apps and Virtual Desktops servers and hypervisors. Historical reports also help perform migration assessments to compare KPIs pre- and post-migration.


