Introduction to Google’s Core Web Vitals Metrics
What Are Core Web Vitals?
Core Web Vitals are a set of performance metrics introduced by Google to help website owners and developers improve the user experience. These metrics are:
- Largest Contentful Paint (LCP)
- First Input Delay (FID)
- Cumulative Layout Shift (CLS)
- Interaction to Next Paint (INP) (Recently replaced FID)

How Core Web Vitals Impact SEO and User Satisfaction
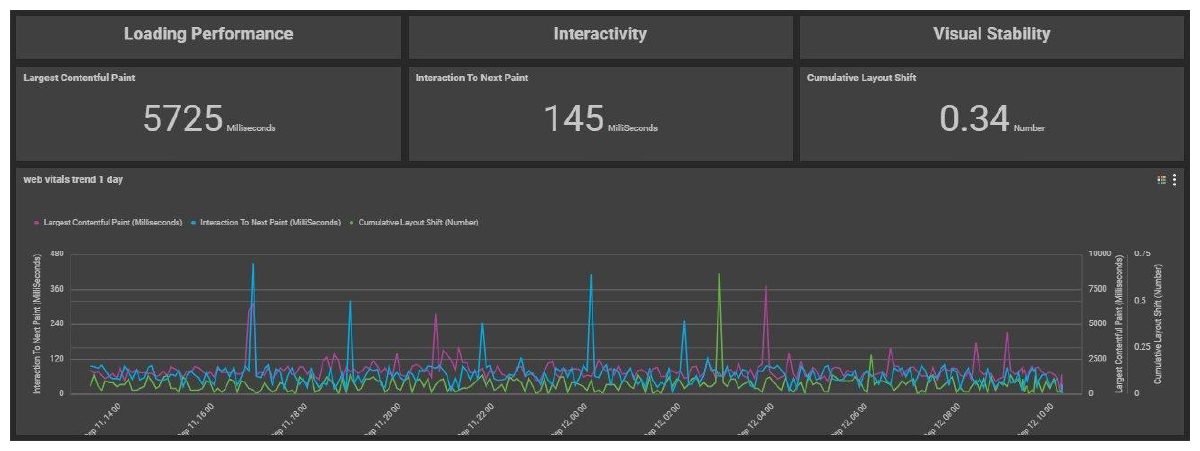
Google’s Core Web Vitals are key metrics that measure the quality of user experience on your website. These metrics focus on three primary aspects: loading performance, interactivity, and visual stability.
For B2B websites, even without relying heavily on search automation, optimizing Core Web Vitals is still important. A faster, smoother user experience builds trust and encourages engagement with business users.
John Mueller, Webmaster Trends Analyst at Google
“Core Web Vitals are part of the experience that helps people stick around on your site, engage with your content, and ideally convert. It’s not just for SEO; it’s good for users.”
For B2C websites, where SEO is a priority, Core Web Vitals have a direct impact on your site’s visibility and Google rankings. By improving these metrics, users are more likely to find your site, stay longer, and enjoy a better overall experience.
Understanding the Key Core Web Vitals Metrics
Largest Contentful Paint (LCP) – What is LCP?
Largest Contentful Paint (LCP) measures the time it takes for the largest visible content element in the viewport to load. This could be an image, video, or a large block of text. LCP is a key measure because it reflects the loading performance of your site and directly impacts user satisfaction. A faster LCP means users can start engaging with your content sooner. Largest Contentful Paint aims to measure when the page’s main contents have finished loading.
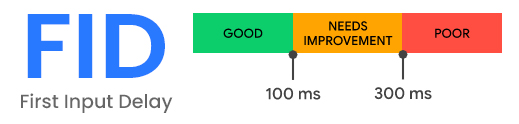
First Input Delay (FID) – What is FID?
First Input Delay (FID) measures the time it takes for a page to respond to the first user interaction, such as clicking a button or a link. FID is essential for interactivity; a low FID ensures that users can interact with your page without frustrating delays. FID was replaced in the Core Website Vitals by INP in 2024 (see: Introducing INP to Core Web Vitals | Google Search Central Blog | Google for Developers).
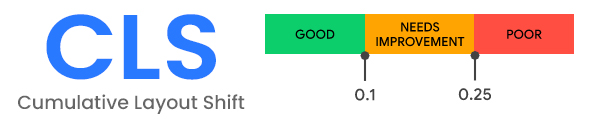
Cumulative Layout Shift (CLS) – What is CLS?
Cumulative Layout Shift (CLS) measures the visual stability of your webpage by tracking how often and how much visible elements unexpectedly shift during page loading. A high CLS score can lead to a poor user experience, as users may accidentally click on the wrong element due to unexpected shifts.
Paul Irish, Developer Advocate at Google Chrome
“Largest Contentful Paint and Cumulative Layout Shift reflect the two most visible parts of the page load experience. They give you real insight into how users experience your site.”
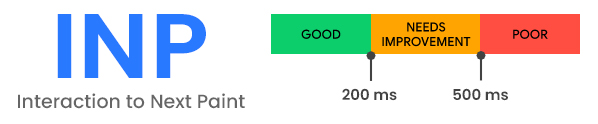
New Metric: Interaction to Next Paint (INP) – What is INP?
What is an “interaction” in the context of INP?
When calculating INP, only the following interaction types are included:
- Clicking with a mouse.
- Tapping on a device with a touchscreen.
- Pressing a key on either a physical or onscreen keyboard.
Interactions such as users hovering, zooming, or scrolling are currently not observed.
Interaction to Next Paint (INP) is a metric that replaced FID. Unlike FID, which measures the delay of the first interaction, INP evaluates the latency of all interactions throughout the lifecycle of a page. Since it is generally accepted that 90% of the time a user spends on a web page is after it has loaded, INP is intended to provide a more comprehensive picture of your site’s interactivity and responsiveness for real users.
A high INP suggests the site feels clunky or unresponsive, making it frustrating for users, while a low INP means the site responds quickly and smoothly to interactions.

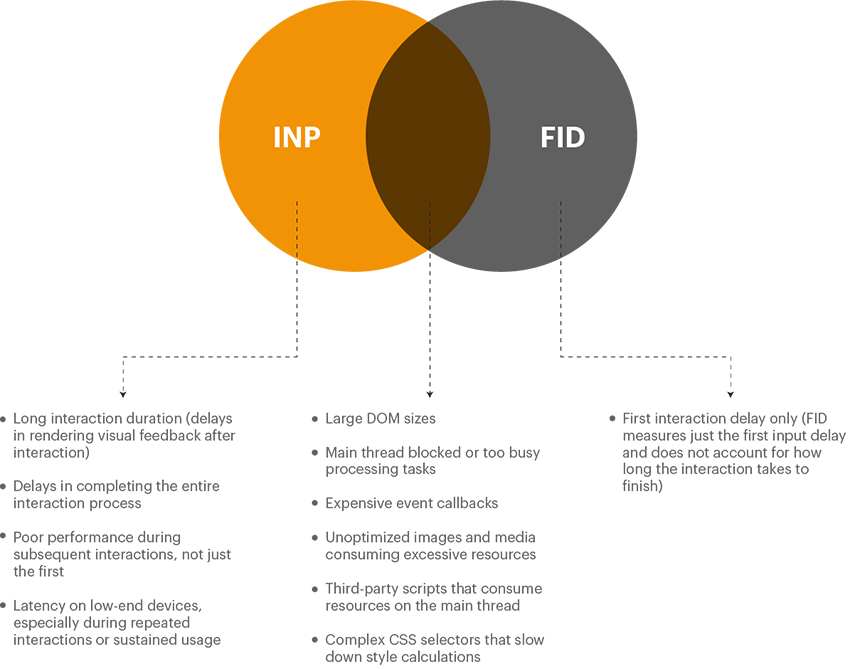
Key Differences Between FID and INP
The key differences between First Input Delay (FID) and Interaction to Next Paint (INP) lie in what they measure and when they measure it:
1. What They Measure :
FID : Measures input delay—the time between a user’s first interaction (click, tap, etc.) and when the browser responds. It focuses on the initial delay before the interaction is processed.
INP : Measures responsiveness across all interactions on a page, not just the first one. It tracks how quickly the page visually responds after every interaction, capturing the full user experience.
2. When They Measure :
FID : Only measures the first interaction after the page starts loading. Once that first interaction is recorded, it does not track subsequent interactions.
INP : Monitors all interactions throughout the entire user session. It reflects how consistently responsive the page is over time by focusing on the interaction that took the longest to process.
What is a Rage Click?
A rage click is when a user rapidly clicks on the same spot or element on a webpage out of frustration, usually because the site isn’t responding or functioning as expected. This behavior indicates that something is broken, confusing, or too slow, leading users to repeatedly try interacting with the element in hopes of a response. Rage clicks are a sign of poor user experience and often point to issues like slow loading times, hidden content, or malfunctioning buttons or links. Monitoring rage clicks can help identify and fix these frustrations to improve usability. Rage clicking often correlates with poor INP values.
3. Scope :
FID : Limited to the first input delay after the page becomes interactive. It’s more about the initial perception of page responsiveness.
INP : Provides a broader, more comprehensive view of overall page responsiveness, tracking multiple interactions and visual updates during the user’s entire session.
4. Use Cases :
FID : Helps improve the early stages of page loading, making sure the first interaction isn’t delayed by tasks like heavy JavaScript execution.
INP : Evaluates the quality of the user’s experience throughout their time on the page, ensuring that interactions beyond the initial load are also fast and smooth.
In summary, FID is focused on the first input during page load, while INP gives a more complete picture by assessing the responsiveness of all interactions on the page.
FID can be misleading if only the first input is fast but subsequent interactions are slow, INP reflects the true interactivity of a page by capturing multiple interaction events, making it a better indicator of overall performance.
Summary of Differences between INP and FID
The primary difference between INP and FID lies in how they measure responsiveness:
- FID measures only the delay before an interaction starts being processed (the time from when a user first interacts to when the browser can begin handling the interaction).
- INP, however, measures the entire interaction process, focusing not just on the initial delay but also on how long it takes for the page to provide visual feedback or respond fully after any interaction. This means INP includes factors like the completion of the response to a user’s input.
What’s new about INP:
Your key takeaways should be:
- INP measures the full duration of interaction, not just the delay before it starts (unlike FID).
- INP captures delays that users experience throughout the interaction cycle, while FID focuses only on the beginning.
Therefore, while FID looks at when the browser is ready to respond, INP evaluates the overall user experience, making it more holistic.
INP covers the entirety of each interaction, from start to finish, including all visual feedback or user-perceived delays.
What is FCP? How does FCP differ to LCP?
First Contentful Paint (FCP) measures the time from when the user first navigated to the page to when any part of the page’s content is rendered on the screen. For this metric, “content” refers to text, images (including background images), svg elements, or non-white canvas elements. In contrast, Largest Contentful Paint (LCP) aims to measure when the page’s main contents have finished loading.
First Contentful Paint is considered an important, user-centric metric as it measures the first point in the page load timeline where the user can see anything happening upon the screen – a fast FCP makes it more likely the user will stay on your website and a slow FCP will encourage users to abandon the site.
Because FCP only captures the very start of the web page loading experience it means that it can be somewhat meaningless in scenarios when a page shows a splash screen / pop-up (interstitial) or displays a loading indicator.
Best Practices for Optimizing Core Web Vitals Metrics
I’ll now cover some information as to how you can improve your Core Web Vital scores and what a good Core Vital score for each metric is.
How to optimize LCP
Here are some optimization tips for LCP:
- Remove unnecessary third-party scripts:
Ads, analytics, video embeds, and widgets can drastically slow down your page. Audit and remove scripts that do not add value to the page experience. - Upgrade your web host or use a CDN:
Faster servers or a content delivery network (CDN) can significantly reduce LCP by lowering the time it takes for content to be delivered to the browser. - Use lazy loading:
Defer loading of non-critical images or media until the user scrolls to them. Ensure you do not lazy load above-the-fold content, as this can delay important visual elements. Avoid lazy loading critical elements like hero images, as this can delay LCP and hurt performance. - Prioritize Image Loading:
Ensure images load before rendering tasks to improve LCP. Use fetchpriority, apply fetchpriority=high to load LCP images sooner. Preload critical resources – use link rel=preload to fetch important resources early. - Optimize large page elements (images, videos):
Compress images and video files to reduce load time, prioritize large images (>10,000px²) for faster LCP. Use modern formats like WebP for images and serve different sizes depending on the device resolution. Progressive JPEGs may delay full image loading and negatively impact LCP. Don’t Use Low-Entropy Images for LCP – exclude low-content images, such as simple backgrounds, from being LCP candidates. - Minify and optimize CSS and JavaScript:
Remove unnecessary spaces, indentations, comments, and unused code from CSS and JavaScript files. Ensure that these resources are lightweight to avoid long rendering times. - Enable preloading of important resources:
By preloading the most important CSS, fonts, or large elements, you ensure faster rendering and load time for the main content. - Reuse Server Connections:
Serve critical resources from the same domain to avoid DNS lookups and handshakes. Avoid additional server connections that slow down resource loading. - Use 103 Early Hints:
Preload resources while waiting for the server’s full response.
An incredibly useful and detailed guide to optimizing LCP is also available from Google Engineers Philip Walton and Barry Pollard, covering JavaScript and html level changes you can make to improve performance, see: Optimize Largest Contentful Paint | Articles | web.dev.
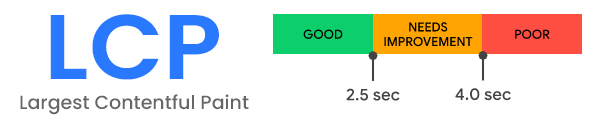
What Value of LCP should I Look to Achieve?
- Good: ≤ 2.5 seconds
- Needs Improvement: 2.5 – 4.0 seconds
- Poor: > 4.0 seconds

Key Strategies to Reduce FID
Some best practices to optimize the FID metric, include:
-
- Defer or break down JavaScript:
As JavaScript is single-threaded, any heavy scripts block the browser from responding to user interactions. Defer non-essential scripts and split large JavaScript files into smaller, more manageable chunks. Use Web Workers – offload intensive tasks (e.g., complex calculations, data processing) to Web Workers, which run in the background and free up the main thread. - Use browser caching:
Browser caching stores reusable resources like JavaScript and CSS files locally, so subsequent page visits load faster, reducing the time to interaction. - Remove non-essential third-party scripts:
Like in LCP, unnecessary third-party scripts can delay browser response. Remove or asynchronously load non-critical scripts to free up the main thread. - Optimize the order of script execution:
Prioritize loading scripts that impact user interaction first. Non-essential scripts (like those for ads or analytics) should be deferred until the browser becomes interactive, lazy loading can be used (learn more: Three Types of Lazy Loading in JavaScript with example | by Muhammad Fauzan | Medium). - Reduce the impact of large JavaScript bundles:
Tree-shake JavaScript code and use performance-optimized libraries. Tree shaking is a methodology to remove dead code. This reduces the amount of script that needs to be parsed and executed on page load.
- Defer or break down JavaScript:
Note: FID (First Input Delay) has recently (Spring 2024) been replaced in the Core Web Vitals set of metrics by INP (Interaction to Next Paint) because INP provides a more comprehensive measure of responsiveness, capturing all interactions, not just the first one.
Understanding Metric Thresholds for FID
-
-
- Good: ≤ 100 milliseconds
- Needs Improvement: 100 – 300 milliseconds
- Poor: > 300 milliseconds
-
How to Reduce CLS
If you are looking to optimize the CLS score of your web pages, some practical tips for improving CLS include:
-
-
- Set size attribute dimensions for all media (images, videos, iframes):
Assigning width and height attributes to media ensures the browser knows how much space to allocate, preventing layout shifts during page load. - Reserve space for dynamic content (ads, banners, etc.):
Ad scripts and other dynamic elements can cause significant layout shifts. Set aside dedicated space in the layout for these elements to load, even before they appear. - Preload key fonts and resources:
Fonts that load late or asynchronously can cause text to shift when they finally render. Preload critical fonts and assets to stabilize layout quicker.
- Set size attribute dimensions for all media (images, videos, iframes):
-
What is an Interstitial Web Page?
An interstitial webpage (or interstitial) is a web page displayed before or after an expected content page, interstitials often to display advertising or for regulatory reasons (e.g. GDPR), such as to confirm the user’s age (prior to showing age-restricted material) or obtain consent to store cookies. Most interstitial advertisements are delivered by an ad server.
-
-
- Avoid inserting content above existing content:
If dynamic elements, like pop-ups or interstitials, are necessary, place them below the fold to avoid displacing critical content and impacting the CLS score. - Optimize CSS for animations:
Avoid abrupt, poorly planned CSS animations or placing CSS inside JavaScript, which could delay the page’s rendering. Follow best practices for clean, lightweight CSS.
- Avoid inserting content above existing content:
-
Google engineering also offer a detailed guide to optimizing CLS with JavaScript code and mark-up level details, see: Optimize Cumulative Layout Shift | Articles | web.dev.
Metric Thresholds for CLS
-
-
- Good: ≤ 0.1
- Needs Improvement: 0.1 – 0.25
- Poor: > 0.25
-
How to Optimize INP
It is important to look at optimizations associated both with JavaScript but also with rendering efficiency.
-
-
- Optimize long tasks. You fundamentally want to avoid blocking the main thread. Yield to the main thread for critical, user-facing tasks. Investigate prioritizing tasks with postTask() and evaluate the use of scheduler.yield().
- Optimize input delay. Input delay is the period of time beginning from when the user first interacts with a page—such as tapping on a screen, clicking with a mouse, or pressing a key—up to when the event callbacks for the interaction begin to run. Every interaction begins with some amount of input delay. If input delay is contributing significantly to INP times, there are optimization options available.
- Script evaluation and long tasks. Look to implement the advice given by Google engineering, see: Script evaluation and long tasks | Articles | web.dev.
- Use web workers to run JavaScript off the browser’s main thread. As with FID this can yield significant benefits.
- Use content-visibility, defer rendering of off-screen elements for improved page responsiveness.
- Avoid large, complex layouts and layout thrashing. Layout Thrashing happens when you request layout information of an element or the document, while layout is in an invalidated state. Layout costs are dependent on the number of elements that require layout, which is a byproduct of the page’s DOM size and the complexity of those layouts. Group multiple DOM changes using document fragments to reduce re-renders.
- Preload critical resources. Ensure fonts, images, and other critical elements are loaded early to avoid layout shifts.
- Don’t break up above-the-fold CSS. Avoid lazy loading or splitting critical CSS, as it causes layout shifts.
- Reserve space for lazy-loaded images: Avoid layout shifts by reserving space for images before they load.
- Don’t add excessive ads. Too many ads can affect page speed, especially on mobile, impacting INP and overall performance.
- Reduce the scope and complexity of style calculations. Simplifying CSS selectors can help speed up your page’s style calculations. Warning: older browsers can be quite poor at handling selectors whilst many newer browsers have optimizations. If you are delivering web pages to the general public, who may well be using older browsers – you will probably want to ensure your QA reflects this.
- Minimize DOM sizes. Large DOM sizes affect interactivity (I’ve added a section below that explains DOM and its relationship to website performance). Always look to minimize the size of the DOM.
- Investigate client-side rendering of HTML when troubleshooting interactivity issues. If your website depends heavily on client-side rendering and you have observed poor INP values in your field data. Techniques such as providing as much HTML from the server as possible and limiting the amount of DOM nodes created on the client can help.
- Keep an eye on upcoming changes. Stay updated on Google’s guidelines as INP becomes a more prominent metric, it is likely the optimization advice will change.
-
Again, Google engineering have a comprehensive guide for optimizing and troubleshooting INP metrics, see: Optimize Interaction to Next Paint | Articles | web.dev.
Target Values for the INP metric
-
-
- Good: ≤ 200 milliseconds
- Needs Improvement: 200 – 500 milliseconds
- Poor: > 500 milliseconds
-
Understanding the DOM and Its Role in Core Web Vitals
The Document Object Model (DOM) is a fundamental concept when discussing Core Web Vitals. The DOM is a programming interface that represents the structure of a webpage as a tree of objects, with each object corresponding to a part of the document, such as elements, attributes, and text.
Why the DOM Matters
-
-
- Performance: The time it takes to parse the HTML and build the DOM directly impacts metrics including LCP and FCP (First Contentful Paint). A large, complex DOM can slow down the rendering process.
- Interactivity: The responsiveness of the DOM, which includes how quickly it can respond to user input, affects metrics like FID and INP. A bloated DOM can lead to delays in interaction handling.
- Visual Stability: Changes to the DOM can cause unexpected shifts in content, impacting the CLS score.
-
Optimizing the DOM
Some tips for optimizing the DOM to improve web page performance, include:
-
-
- Keep the DOM Lean: Avoid unnecessary elements and reduce the depth of the DOM tree.
- Efficiently Manage DOM Updates: Batch updates to reduce reflows and repaints.
- Use Virtual DOMs: Frameworks like React use a virtual DOM to minimize direct manipulations, improving performance.
-
You can learn more about the history and specification details of the DOM in Document Object Model – Wikipedia, What is the DOM? and Introduction to the DOM – Web APIs | MDN (mozilla.org).
Next Steps – Advanced Analysis and Optimizations for Core Web Vitals
Barry Pollard, Web Performance Expert and Author
“Measuring and improving Core Web Vitals is not a one-time effort. It should be part of a continuous process to ensure that your site consistently delivers a great user experience.”
Understanding Core Web Vitals at a granular level is crucial, and that’s where multi-dimensional analysis comes in. By slicing and dicing data across various dimensions—such as browser type, device, or geographic location—you can uncover hidden performance issues that may only affect specific user segments. This approach allows for more targeted optimizations, ensuring a seamless experience for all users, no matter their setup or location.
In the next blog, we will dive deeper into how multi-dimensional analysis can help you fine-tune your Core Web Vitals performance across different user environments.
Conclusions on Core Web Vitals
Continually monitoring Core Web Vitals is essential because they directly impact user experience and SEO rankings. Regular tracking helps identify performance issues that can degrade page load speed, interactivity, and visual stability. As user behavior, site content, and browser technologies evolve, ongoing monitoring ensures sites remain optimized, competitive, and compliant with Google’s search algorithms. It also helps you quickly detect and root cause issues so you can resolve them and address regressions or bottlenecks that could lead to higher bounce rates, lower engagement, and reduced conversions.
Addy Osmani, Engineering Manager at Google
“Core Web Vitals are the best proxy we’ve ever had for user experience performance. It’s not about optimizing for scores but about ensuring users feel your site is fast and responsive.”
However, the Core Web Vitals metrics often only act as a canary in a coal mine, i.e. as a symptom of an issue with the platform, hardware, networking and so on, that is serving up the web page. I’ll be covering more on this (in future articles) and how to ensure slow web page tickets are diverted to the infrastructure or database teams if the problem actually lies in their remit.
eG Enterprise is an Observability solution for Modern IT. Monitor digital workspaces,
web applications, SaaS services, cloud and containers from a single pane of glass.
 Arun is Head of Products, Container & Cloud Performance Monitoring at eG Innovations. Over a 20+ year career, Arun has worked in roles including development, architecture and ops across multiple verticals such as banking, e-commerce and telco. An early adopter of APM products since the mid 2000s, his focus has predominantly been on performance tuning and monitoring of large-scale distributed applications.