Customers evaluate a modern observability and monitoring solution by the ROI they get, self-monitoring capabilities ultimately improve scalability and quality. The value of any observability solution lies in its ability to proactively detect and alert customers to issues before they cause a business-impacting outage. IT infrastructures and applications can fail in many different ways. A run-away process, a memory leak in an application, an application that fails to release database connections, a mis-configured system, etc. can all result in IT outages, and therefore, it is imperative that a modern observability solution collects and analyzes a wide range of different metrics. For a single system, thousands of metrics may have to be collected and analyzed in real-time. For a large infrastructure with thousands of systems and applications, it is no surprise that eG Enterprise has to collect and analyze millions of metrics.

Figure 1 shows a snapshot of the eG Enterprise console of a production deployment managing over 6000 components. 12 million measurements is a lot of metrics, logs, traces and tests! Far more than a human operator can process or overview and only possible because of powerful AIOps-engine at the heart of eG Enterprise. Without AIOps capabilities, the burden of configuring thresholds for each metric, manually setting alerts and tracking them over time is put on the human administrator – an impossible job!
Scaling an observability platform to process tens of millions of events, metrics, logs, and traces daily is no small feat. eG Enterprise achieves this with a combination of efficient design principles, AIOps-powered automation, and self-monitoring capabilities that ensure continuous optimization.
We also have to pay considerable attention as to how this data gets processed and presented into human-consumable overviews. This blog covers how eG Enterprise scales to collect, analyze and report on millions of metrics.
Step 1: Design to Minimize Inefficiencies
A distributed monitoring approach is used to scale the monitoring. As the target infrastructure scales, you can add additional “remote” monitors for agentless monitoring of the infrastructure. Multi-threading concepts are used to ensure that the monitoring can scale as required. And you can configure the remote monitors to operate in a highly available cluster to avoid a single point of failure.
While the management server is the heart of the eG Enterprise system, storing and analyzing metrics, the actual analysis of the metrics is performed by the agents. This distributes the workload across the infrastructure, minimizing the chance of the eG Enterprise manager becoming a single point bottleneck.
eG Enterprise also uses a concept of management by exception. Its state analysis and alarm correlation engine only analyzes problematic metrics and correlates them, thereby minimizing the analysis effort that it performs.
The data processing, analysis and user interfacing components are segregated from one another, ensuring that there’s minimum interference between these components. Modern data processing mechanisms such as data partitioning are used to ensure that even if the database grows to many Terra-bytes, the monitoring system remains functioning at its peak.
To minimize data collection and storage overheads, the default models of the system are designed with scalability in mind. For example, there is no point sampling Azure billing metrics every 3 seconds as they are only updated a few times a day.
While scalability of the management system and the agents are important, it is equally important for the communication between the management system and agents to be efficient. Inefficiencies can result in overloading the network, impacting the performance of the very infrastructure that the monitoring system is supposed to oversee. eG Enterprise leverages caching where appropriate to ensure that configurations are not repeatedly communication. Compression techniques are used to minimize bandwidth usage for metrics storage, accelerating performance and lowering costs.
eG Enterprise continually self-monitors every deployment so we get continual feedback and a deep understanding of how the platform behaves under different customer use cases. These insights and understandings from self-monitoring are fed into iterations of the solution’s architecture.
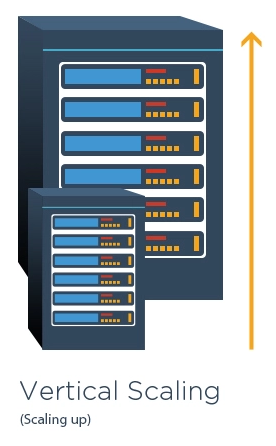
Step 2: Scale Horizontally as well as Vertically
 For a scalable architecture, it is recommended to have the management server and database on separate systems. In a cloud deployment, a database service like Amazon RDS or Azure SQL can be used as well. Compute and data processing resources in the eG Enterprise architecture can be distributed and scaled as required, by allocating additional compute, memory and storage resources. A sizing calculator is available to compute the resources needed for the management server and database.
The “remote” monitors used for agentless monitoring can also be scaled up if required to monitor hundreds of devices or virtual machines. Multi-threading is used extensively on the manager and agents to achieve scale up.
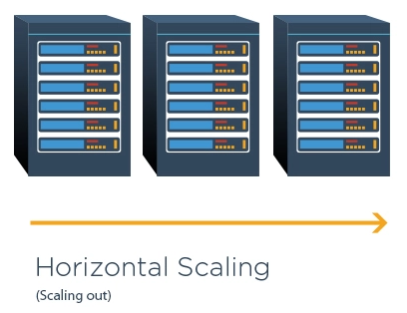 Horizontal scaling is supported by enabling multiple eG Managers to operate in parallel and report to a central Super Manager. This hierarchical setup allows organizations to monitor expansive IT environments efficiently by distributing workloads across several eG Managers, each handling specific segments of the infrastructure. The Super Manager aggregates data from all eG Managers, providing a unified view of performance and health metrics without overloading individual components.
Note that the data collection, analysis and retention is still performed by the individual managers, to ensure that the SuperManager does not become a single point bottleneck. The SuperManager configuration can be used for scalability – to handle tens of thousands of systems and hundreds of thousands of devices and VMs. This architecture can also be used for efficiency when handling geographically distributed environments. The agents can report to the manager local to them, ensuring that data does not leave their local region and minimizing bandwidth usage. At the same time, this architecture also allows for distributed administration: each region administers and manages their local deployment and the SuperManager is mainly for consolidated monitoring across regions.
Step 3: Code-level Efficiency – Adhere to Best Practice and then Self-Monitor
eG Enterprise makes extensive use of Java technologies, and we adhere to Java best practices for scalability and efficiency. Best practices we follow are well documented in our earlier blogs and include:
- JVM tuning, optimizing garbage collection and leveraging thread pooling to avoid bottlenecks: https://www.eginnovations.com/blog/how-to-enhance-performance-java-applications/
- Java coding best practices for scalability: https://www.eginnovations.com/blog/6-tips-fast-java-applications/
- How to enhance database access performance from Java applications: https://www.eginnovations.com/blog/java-application-performance-tips/
- Java application performance monitoring best practices including detecting JVM-related issues, such as memory leaks or CPU spikes, etc.: see: Java Application Performance Monitoring White Paper.
- Configuring full stack visibility for proactive monitoring and troubleshooting: How to Get Full-Stack Visibility for Your Java Applications – A Comprehensive Guide | eG Innovations
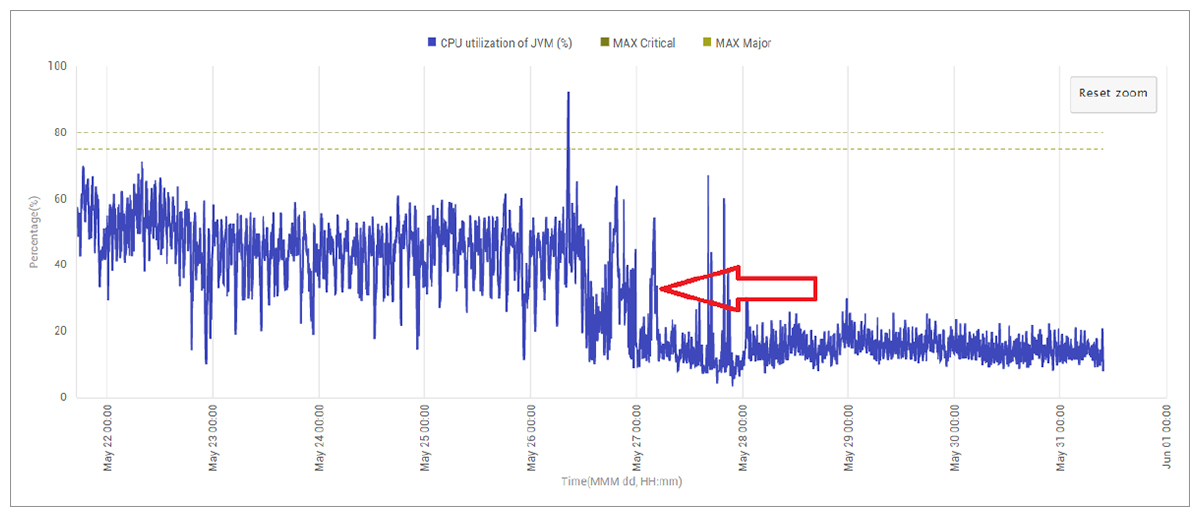
In How to make Java run faster – 6 Tips | eG Innovations we covered some common best practice Java coding advice and show how simple code optimizations directly impact on JVM resource usage and in turn cloud computing costs. See figure 2 below.
We also make extensive use of eG Enterprise’s APM capabilities. For instance, using eG Enterprise’s transaction tracing capabilities, we can detect inefficiencies in our code or queries and address them at the earliest opportunity in the development lifecycle.
You can read more of our recent Java best practice blogs, here: Java Monitoring Archives | eG Innovations.
Step 4: Enable Complete Visibility and Self-Monitoring
Over the years, we have built extensive self-monitoring capabilities into eG Enterprise. Almost every aspect of eG Enterprise is monitored. This includes it’s AIOps engine, the database purging process, the integration with ITSM systems like ServiceNow, the database storage, interfaces with email systems, and so on. Self-monitoring of eG Enterprise is enabled by default in every deployment and allows us to monitor the workings of the eG Enterprise management system and our agents in-depth. This self-monitoring capability allows our team to pinpoint inefficiencies, identify scaling challenges, and apply timely fixes.
Self-monitoring also helps us troubleshoot issues quickly in customer deployments. E.g., from the metrics eG Enterprise collects, we can highlight if a customer’s database is not working well, or if their email system has become slower than normal, thereby impacting eG Enterprise’s performance. This helps our customer support teams troubleshoot issues quickly and resolve them.
Customers themselves can also review the eG Enterprise metrics and detect and resolve issues by themselves.
A wonderful thing about eG Enterprise’s APM (Application Performance Monitoring) is that you can use it to monitor all your other IT applications and management tools, beyond just end-user apps. You can get visibility into how efficient all those Java, .NET, Node.js and PHP tools really are. This is particularly important if those apps are being run as native cloud apps backed by cloud resources that you are paying for. We recently covered a case study analyzing the performance and efficiency of a .NET app popular for managing AVD (Azure Virtual Desktop) deployments, where scaling the database unnecessarily (with additional costs) can be avoided using an enterprise monitoring tool, see: Monitoring and Troubleshooting Nerdio | eG Innovations.
This type of monitoring is also important if you are looking to migrate any applications to a cloud, a good overview of how to leverage APM to shift-left in such a migration is covered in, Shift Left Monitoring: A Pathway to Optimized Cloud Applications | eG Innovations.
Step 5: Leverage AIOps for Continuous Optimization
AIOps automation powers eG Enterprise’s ability to process millions of metrics seamlessly. By analyzing this volume of data in real-time, the platform automatically identifies anomalies, automates root-cause analysis, and can recommend improvements or even automate self-healing remediation. This approach in our self-monitoring ensures that eG Enterprise remains resilient and agile, even within dynamic and ephemeral modern IT systems where auto-scale events are now a normal part of operations (environments such as OpenShift, Kubernetes). Moreover, it ensures that every application and infrastructure component benefits from the same comprehensive analysis – even if that necessitates monitoring 12 million measures!
Importantly, AIOps removes manual effort which makes a significant difference in large-scale systems where manual deployment is unfeasible. Even within auto-scaled environments eG Enterprise can ensure day-0 coverage via auto-discovery, auto-deploy and universal agent technologies. Moreover, AIOps auto-baselining combined with domain-aware intelligence means you get metric thresholds, alerting and anomaly detection out-of-the-box. Even at moderate scales, a human operator simply can’t spot problems, let alone anomalies and must rely on their monitoring and observability tooling to proactively do so.
Scalability in Monitoring needs to be Affordable
If you are monitoring 12 million metrics, it needs to be cost effective. Many observability solutions charge per metric and per alert. Azure Monitor charges $0.10 per alert per month. This means that many aren’t able to scale their monitoring coverage not due to architectural limitations in monitoring tools or the infrastructure resources demanded to process data at the scales needed – but simply because they can’t afford to turn monitoring on! eG Enterprise differentiates itself for many in that we avoid licensing models that scale unaffordably – see: eG Enterprise IT Monitoring Licensing – Cost-Effective & Flexible. Scalability shouldn’t mean it is your costs that are scaling!
Summary
By following the best practices described above and by leveraging the same AIOps-driven insights we offer to customers, eG Enterprise ensures smooth operation of our own solution at scale. Whether monitoring thousands or millions of metrics, the platform remains agile, resilient, and ready to evolve with business needs (and at an affordable cost!).
eG Enterprise is an Observability solution for Modern IT. Monitor digital workspaces,
web applications, SaaS services, cloud and containers from a single pane of glass.