If you are responsible for virtual machines in an IT infrastructure, you’re probably already aware that metrics like CPU ready time, balloon memory, IOPS, etc. are important indicators of how the virtual infrastructure is performing. These metrics together provide what we refer to as the “outside view” of a virtual machine. The virtualization platforms – whether VMware vSphere, Citrix XenServer, or Microsoft Hyper-V – provide metrics that can be used to construct this outside view of a virtual machine (VM).

The outside view of a virtual machine focuses on the resources of the physical machine and how these resources are used by the different VMs. Using the outside view, you can answer questions such as “Which VM is responsible for the resource utilization of a machine” and “is the physical machine adequately sized – does it have sufficient CPU or memory resources to handle its workload”.
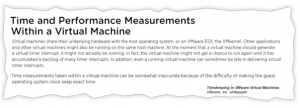
For long, there have been many who have suggested that the outside view of a VM is the only way of monitoring a virtual infrastructure. One of the main reasons for this is that time-based measurements made inside the VMs are likely to be inaccurate because when a timer interrupt is supposed to happen, a VM may not be running. As a result, metrics such as response time, requests per second, disk I/O per second, etc. taken from within the VM’s operating system are not absolute performance indicators.

From our practical experiences with virtual infrastructures, we have observed that the outside view of a VM alone is not sufficient for effectively managing a virtual infrastructure. With the outside view of a VM, an administrator can determine which VM is taking up excessive resources. However, the immediate next question is always “WHY is the VM taking up resources” – i.e., is it because of excessive load on the VM? is it because of a run-away process running inside the VM? To answer such questions, it is important to understand what is happening inside the VM. This is the “inside view of a VM”. Together, the inside and outside views provide 360 degree visibility into the VM.
eG Enterprise provides the inside and outside view of VMs using the same agent. The licensing is very simple too – a single monitoring license is required per physical machine and is sufficient to monitor all the VMs – both from the outside and from the inside. To understand more about eG Enterprise’s unique In-N-Out monitoring capabilities for VMs, check out this presentation ».
eG Enterprise’s In-N-Out monitoring of virtual machines addresses the limitations of time-based monitoring inside the VMs in the following ways:
- Clock skews only impact metrics that are time-based. Many metrics collected within a VM are not time-based – for example, memory usage of processes, handle usage of processes, processes queued waiting for disk requests, etc. – yet, these metrics can reveal very useful information about activity within the VM.
- Clock skews make metrics obtained from within a VM unreliable as “absolute” indicators of performance. Metrics from within a VM are still very good “relative” indicators. For example, by comparing the percentage of CPU usage or the disk I/O rates for each of the applications, one can determine which applications are responsible for the resource usage of a VM being high.
For more information on eG’s In-N-Out monitoring for virtual infrastructures, click here »
eG Enterprise is an Observability solution for Modern IT. Monitor digital workspaces,
web applications, SaaS services, cloud and containers from a single pane of glass.


