 Today, it’s a common practice to SSL-enable web applications and websites. It’s beneficial for SEO and it is also needed for compliance. Many regulatory compliance standards mandate that web applications and websites are using SSL certificates.
A key part of SSL-enabling a web application is configuring the SSL certificate. An SSL certificate (also known as Digital Certificate) is used to create a secure link between a web application and a visitor’s browser. It is used to keep sensitive information encrypted as it is sent across the Internet so that only the intended recipient can access it. SSL certificates can be issued by a public authority or can be privately signed. Especially for applications that are used internally within an organization, IT teams may prefer to use privately signed certificates. In such cases, when accessing such web applications, you will see a “not secure” indication on the browser’s address bar.
![]()
So, what impact do private certificates have on web application performance? It is generally believed that while such applications have a lower level of security (because of the private certificate), the performance of the application will be similar to that if the application were to be configured with a public certificate. But that is not necessarily the case. Here’s a real-world example of how we troubleshooted a slow web app and what we discovered as the culprit.
Can Web Application Upgrade Cause Application Performance Issues?
The eG Innovations support team was called in by our customer to help with a web application that was performing poorly. Users (internal users in the organization) from specific locations were complaining of very poor response times. In fact, they were unable to perform their routine tasks and this resulted in a loss in productivity.

The application was architected several years ago and had been running on a Windows Server 2008 with an Oracle 12c database backend. The application server was Tomcat version 6.0.32 powered by Java 1.7. Recently, the application was upgraded to the latest release: Windows Server 2019, Oracle 18c, Tomcat 9.19 and Java 10. Since the upgrade had not been fully certified and the usage was mainly from internal users, a privately signed SSL certificate was implemented for the upgraded application.
During the upgrade, several changes had been made. The OS, database, application server, application code, JVM and even the antivirus technology in use had been migrated. So, pinpointing the exact reason for application performance slowdown was a challenge.
Troubleshooting the Cause of Application Slowness
 Since users reported poor performance only from specific sites, network connectivity from these sites was the first suspect. The sites complaining of slowness had network latencies of 260 ms to the target systems, while the ones not complaining had an average latency of 20 ms. So, an obvious question was, “Is network connectivity the cause of the problem?” Since the customer had both the original and the upgraded web applications operational at the same time, we configured synthetic URL monitoring to target both the application versions from the sites that were complaining about issues. The table below summarizes the results.
| Throughput to Upgraded Application | Throughput to Original Application | |
|---|---|---|
| Download of a 10KB URL | 2390 Kbps | 2427 Kbps |
| Upload of 10KB to a URL | 1866 Kbps | 1963 Kbps |
 The throughput to the upgraded application was roughly similar to what we had observed for the original application. Up until the upgrade, users had not complained about performance issues with the original application. Hence, the results of synthetic monitoring ruled out network connectivity and throughput from the slow web application as being the cause of the problem. Furthermore, since the upload and download involved access to web URLs of the application, it was unlikely that the application itself was slow. If the upgraded application had been much slower than the original application, we should have seen a significant difference in throughput using synthetic monitoring. This was not the case.
 The upgraded application was not yet in full production usage. Utilization of server resources – CPU, memory, and disk activity – were well below 10%. Hence, a server bottleneck was also unlikely. So, it was not the network, it was not the application, nor was it the server. And yet, users were complaining of severe slowness.
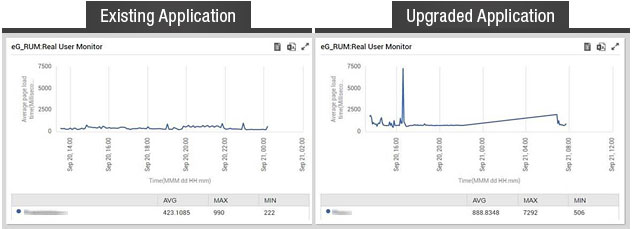
eG Enterprise’s Real User Monitor was configured for the upgraded application to further diagnose the problem. Average page load time metrics revealed that for a web application that was experiencing problems, it was seeing double the average response time of a web application that had no slowness. Maximum response time was significantly higher as well for the slow web application.
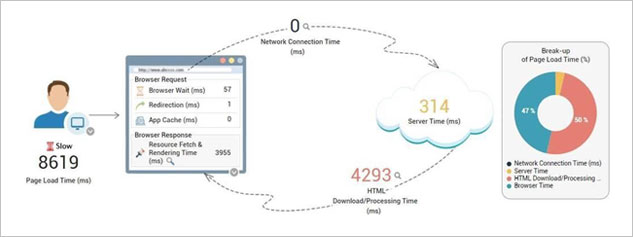
Analysis of the download/processing time highlighted the resources that get downloaded when the page is rendered. Notice that the topmost resource is close to 1MB in size and takes 4+ seconds to download. This resource was downloaded again and again every time the application pages were accessed.
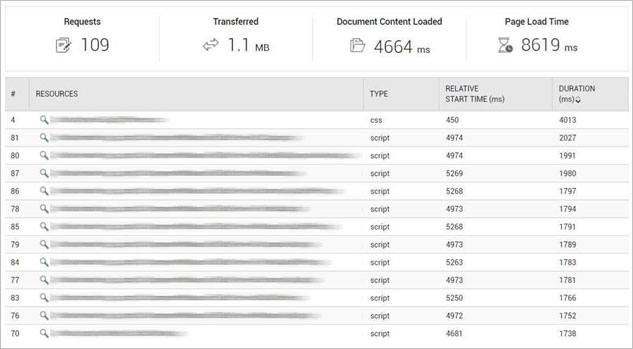
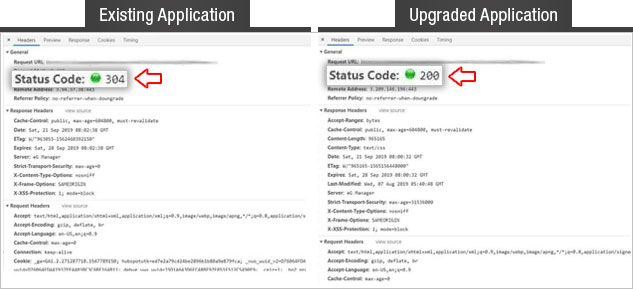
But in the case of the upgraded application, the script files are being downloaded every time. This was the cause of higher response time.
The historical report in eG Enterprise (figure below) generated for that period also showed the same thing: That content download time and browser rendering time were causes for concern.

 Because the upgraded web application had been configured with a self-signed SSL certificate, it was preventing the browser from caching CSS and JS scripts, resulting in increased network traffic when the web application was accessed. In turn, this resulted in poor response time for end users.
How the issue was fixed: Deploying a valid public certificate for SSL resolved the performance issue in the web application.
Using eG Enterprise’s Real User Monitor, you can easily detect the cause of slow web application issues – whether it is server-side issues, network issue, client browser issue or content download.
eG Enterprise is an Observability solution for Modern IT. Monitor digital workspaces,
web applications, SaaS services, cloud and containers from a single pane of glass.


