The Role of AIOps in IT Operations Management
In all internal and external conversations that I’ve had in the recent weeks, almost always the discussion veers towards AIOps. This blog summarizes research that I’ve done into understanding AIOps – what it is, why analysts and customers are so interested in this technology and what are some of the benefits that it offers.
What is AIOps?
AIOps (Artificial Intelligence for IT Operations) is a term coined by Gartner in 2016 as an industry category for machine learning analytics technology that enhances IT operations analytics covering operational tasks include automation, performance monitoring and event correlations, among others.
Gartner themselves define [1] an AIOps Platform thus: “An AIOps platform combines big data and machine learning functionality to support all primary IT operations functions through the scalable ingestion and analysis of the ever-increasing volume, variety and velocity of data generated by IT. The platform enables the concurrent use of multiple data sources, data collection methods, and analytical and presentation technologies.”
What is the Need for AIOps?
Decades ago, IT operations used to be simple. There were few IT components involved – client, server, network, etc. and the environments used to be static. Manual analysis of such infrastructures was the way in which IT teams managed them. Over the years, there have been several significant changes in IT operations:
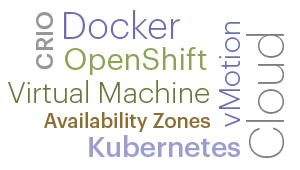 IT environments have become very dynamic: Technologies like containers and orchestration (e.g., Kubernetes) now make it possible for systems and applications to be elastic – i.e., be provisioned dynamically as demand increases and to be scaled down as demand reduces, with no manual intervention. Manual analysis of such environments is just not possible.
- IT environment complexity has increased and monitoring involves big data: As IT technologies have become more automated, there have been many new components introduced in an IT architecture. Failure or malfunctioning of any of these components can affect IT services. Hence, every one of the components in an IT infrastructure need to be monitored. This dramatically increases the amount of data that has to be collected and monitored. IT operations teams regularly collect metrics from components as diverse as thermostats, power supplies, CPU, memory, application logs, user end points, mobile devices, virtual machines and a whole host of infrastructure services. Performance monitoring has well and truly become a big data problem. It is impossible to manually analyze and discern performance of every component in the service delivery chain.
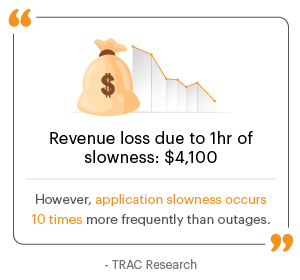 IT has become vital for businesses: As businesses have become more digital, they have become more dependent on IT. Failure of IT systems or slowness of these systems can affect business revenues. For example, consider a scenario where hundreds of workers from home are not able to login to a corporate network to do their jobs. This could cost the business hundreds of thousands of dollars in lost productivity. Hence, the need for IT operations to be proactive and efficient, so when a problem happens, it is resolved in the fastest possible manner.
- Shortage of expert IT staff is a burden for IT operations teams: IT organizations are struggling to deal with shortage of expert IT staff. As a result, there is an expectation of IT operations to do more with less resources. This can only happen with more intelligent software that can automate and simplify IT operations tasks.
IT operations teams spend 25% of their time every week in troubleshooting digital workspace issues.
All of the above factors are leading to the increased adoption of AIOps technologies.
Components of a Typical AIOps Platform
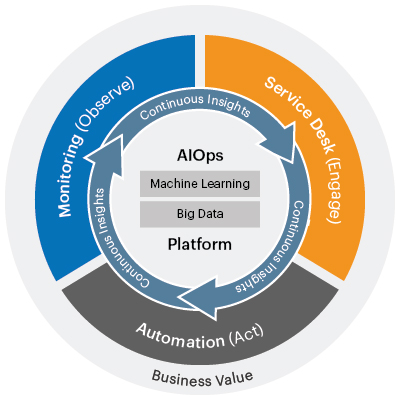
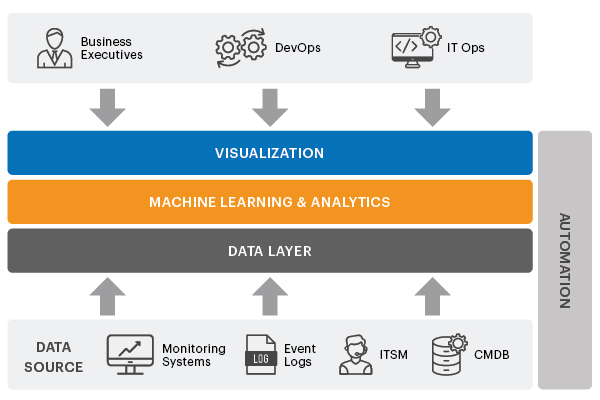
The figure below shows a simplified view of the different components of an AIOps platform:
- The data layer acts as the eyes of the AIOps platform, continuously observing the IT landscape. Metrics/data are obtained from different sources in the IT landscape. Data sources can include different monitoring tools, application logs, ITSM tools, etc.
- The AI layer is the brain of the platform – it uses the data that is ingested and extracts actionable insights out of it. Different forms of machine learning including anomaly detection, prediction and correlation are some of the capabilities embedded in this layer.
- The visualization layer offers the interface through which different stakeholders – business executives, DevOps teams, IT Ops teams, etc. interact with the platform.
- The ultimate goal of AIOps is to simplify and automate IT operations. Based on the results of monitoring and analysis, intelligent automation can be used to automatically address anomalies/issues in the IT landscape, wherever possible. This is where IT automation comes in.
Top AIOps Use Cases
AIOps can support a wide range of IT operations processes. Here are the top use cases of AIOps:
- Intelligent alerting and escalation: By observing event patterns and trends, AIOps tools can detect abnormal performance patterns and provide intelligent and proactive alerts to IT operations teams. This ensures that alert fatigue that IT operations teams often have to deal with. With AIOps tools, IT operations teams don’t have to deal with hundreds of spurious alerts but can focus only on real problems.
- Event Correlation and Root Cause Analysis: IT applications use a number of software and hardware tiers and when a problem happens in one tier, this can ripple and affect all the other tiers as well. AIOps tools analyze data from all tiers, create causality/relationships, providing IT with correlated insights using which they can determine where the root-cause of a problem lies.
- Anomaly detection: By analyzing millions of performance metrics over time, AIOps tools identify anomalies in the infrastructure that if rectified can improve service performance and infrastructure utilization. Such proactive detection of performance issues can also avert service downtime and business impacting situations.
- Automated incident management: Enterprises can not only set automatic alerts for incidents but also trigger automatic system responses to remediate the issues. By automating and resolving incidents in near real-time, enterprises can deliver a seamless user experience.
- Capacity planning and management: Using AI-based, data-driven recommendations, workloads can be mapped to the right combination of servers and machines. With AI-enabled, real-time insights, IT teams can improve the capacity of IT infrastructure while reducing operational costs.
Benefits of AIOps
By now it should be clear why many organizations are looking to adopt AIOps technologies.


eG Enterprise is an Observability solution for Modern IT. Monitor digital workspaces,
web applications, SaaS services, cloud and containers from a single pane of glass.
Glossary of terms and acronyms commonly associated with AIOps
| AI | Artificial Intelligence |
| AIPA | Artificial Intelligence Predictive Analytics. A superset that includes AIOps. |
| APM | Application Performance Management / Monitoring |
| Auto-topology discovery and mapping | Technology that understands and discovers the topology of IT applications and services. Involves discovering all the different types of dependencies in an IT infrastructure. It includes application to application, application to virtual machine, VM to physical machine, application to network device, and other types of dependencies. |
| Big Data | Big data is a term applied to data sets whose size or type is beyond the ability of traditional relational databases to capture, manage and process the data with low latency. Big data has one or more of the following characteristics: high volume, high velocity or high variety. Big data can be a combination of structured, semi-structured and unstructured data. |
| CMDB | Configuration Management Database. The CMDB should be a trusted source for providing an updated inventory of IT devices, infrastructure and relationships. |
| DCIM | Data Centre Infrastructure Management |
| DEM | Digital Experience Monitoring. Gartner defines DEM as “an availability and performance monitoring discipline that supports the optimization of the operational experience and behavior of a digital agent, human or machine, as it interacts with enterprise applications and services. |
| DevOps | Developer Operations |
| HDIM | Hybrid Digital Infrastructure Management. A solution that encompasses external services from colocation, cloud providers, edge environments and the Internet of Things (IoT) that are now being added to the traditional data center infrastructure. |
| HIM | Hybrid Infrastructure Management |
| ITIL | IT Infrastructure Library. A popular global ITSM best practice framework including a set of detailed practices for IT activities such as IT service management and IT asset management that focus on aligning IT services with the needs of business. |
| ITIM | Information Technology Information Management |
| ITOM | Information Technology Operations Management |
| ITSM | IT Service Management |
| ML | Machine Learning. Machine learning uses algorithms to parse data, learn from that data, and make informed decisions based on what it has learned. |
| MSP | Managed Service Provider |
| MTBF | Mean Time Between Failure |
| MTTD | Mean Time to Detect |
| MTTI | Mean Time to Investigate |
| MTTR | Mean Time to Resolution Mean Time to Repair |
| Mura | (English: Unevenness or irregularity): Eliminating unevenness or irregularities in the production process is one of the main principles of the Just-In-Time system, the main pillar of the Toyota Production System. |
| NN | Neural Network |
| NPM | Network Performance Monitoring |
| NPMD | Network Performance Monitoring and Diagnostics |
| Observability | Solutions that enable the aggregation, correlation and analysis of streams of performance data from distributed applications and the hybrid infrastructure which support applications. Usually include the ingestion of metrics, events, logs and traces (MELT) to obtain insights. |
| SLA | Service Level Agreement. The level of availability an MSP or Cloud provider commits to provide by contract. Typically, a commitment to availability >99% of the time. |
| Temporal alert correlation | Determining time-related connections between events. |
| Thresholding | A threshold is a limit set within a monitoring tool for a metric, so that if a metric crosses this value an alert is raised |
| Topological correlation | Determining associations between events based on physical relationships and connections between elements of the infrastructure. |
eG Enterprise is an Observability solution for Modern IT. Monitor digital workspaces,
web applications, SaaS services, cloud and containers from a single pane of glass.


