 A new year is upon us once again; the holidays are over and it’s time to get back to work. Happy New Year to all of you. Now how many of you have better monitoring as part of your New Year’s resolution? You want to implement better Citrix monitoring tools, right? You want your end-users to experience less technical faults by having a system in place that allows you and the team to be more proactive.
OK, probably not what you have been thinking as the clock struck midnight, but it should be part of your professional goals for 2020. The reason being is that you simply cannot run IT infrastructure effectively without monitoring in place.
 |
Monitoring on-premises Components is of Importance Microsoft Azure and Office 365 are monitored 24/7 by Microsoft. Citrix Cloud is monitored 24/7 by Citrix. If any of those services are impacted by a technical fault, the fault needs resolved fast. How do you resolve an issue quickly with no monitoring in place to direct you to the problematic area of your infrastructure? The major cloud services are monitored from head to toe, and the approach should be no different when it comes to your on-premises components, such as:
|
I mention monitoring on-premises components; however, some of these components may be located in Azure, GCP, or AWS. This adds further complications onto monitoring or at least changes the scope of monitoring.
- With a hybrid architecture being used by your organization, you now must monitor the network links between your organization and the cloud service and attempt to monitor the cloud resources themselves.
- Monitoring cloud components can present a slight challenge. The storage, networking and other components are often solely managed and monitored by the cloud service provider, which takes some workload off from your team, but there is still a degree of monitoring you can and should do. For example, when using Azure IaaS to store data, applications, operating systems, when application servers or desktops are hosted in the cloud, you still need to monitor those.
This is where monitoring products will look to continue innovating in 2020. A lot of organizations are moving some of their infrastructure into the cloud. Monitoring solutions will endeavor to support that move, if they have not done so already, allowing you to effectively monitor the infrastructure wherever it may be situated.
With all that said, let’s take a look at some of the monitoring products that will more specifically help you monitor your Citrix Virtual Apps and Desktops deployments whether they are on-premises or in the cloud.
Built-in Citrix Monitoring Tools
Citrix has produced different tools that can monitor the Virtual Apps & Desktops and ADC load balancers you deploy.
Citrix Director
Every organization that runs a Citrix Virtual Apps and Desktops deployment will be familiar with Citrix Director.
Citrix Director is a free product with your Virtual Apps & Desktops licensing. I say free, however, note that some monitoring features are restricted by license type; for example, Premium licensing will unlock the ability to integrate HDX Insight from Citrix ADM with Director.
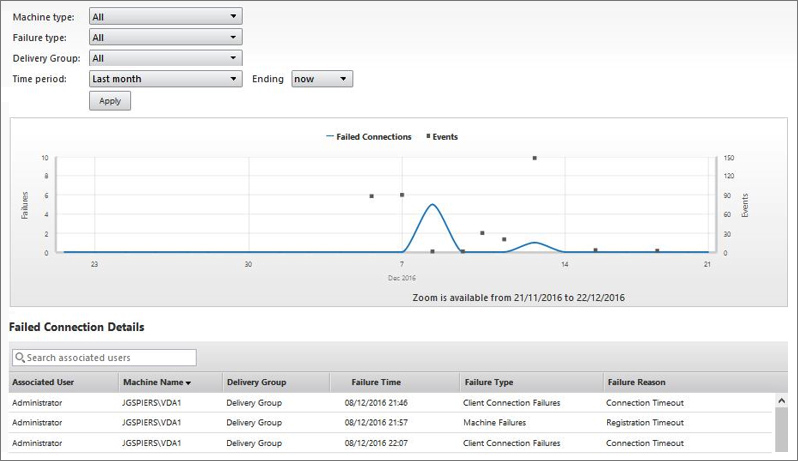
Director is a key tool used to collect analytics in Virtual Apps and Desktops deployments. It is a key tool for both helpdesk staff supporting your end-users day-to-day and Citrix administrators alike, making it easier to support and manage your applications and desktops.
To help your helpdesk personnel, Citrix Director records user session information, such as:
|
|
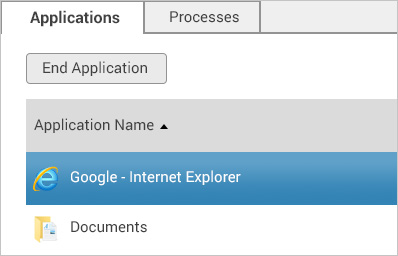
More information is captured about the user session, which helps IT further understand about the user without having to ask questions. This extra information makes it easier to effectively troubleshoot end-user issues as they arrive to the helpdesk, as you are more prepared.
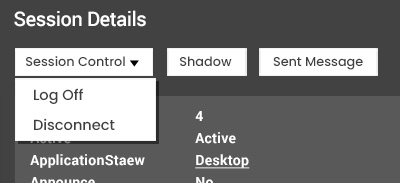 You can also control the user session using Session Control, providing you the ability to log off a session, disconnect it, send the user a message, or shadow the session, which uses Windows Remote Assistance to interact with the user’s Citrix session.
To assist Citrix administrators who manage the Virtual Apps and Desktops deployments, Citrix Director captures analytics in the form of:
- Average logon times across your desktops and application servers
- Average Memory, CPU, IOPs, Disk Latency, and GPU (if applicable) across your different desktops and application servers
- Application failures, user session launch failures, desktop and application server failures
- Concurrent session information, peak concurrent sessions, peak disconnected sessions etc.
- Monitoring of Delivery Controller services, license server connection state, SQL server connection state, and hypervisors
You can set up alerting to be notified when logon time averages are higher than a configured threshold, when ICA RTT averages are high, or when the connection failure rates are high, etc. There are many different configurable alerts to set.
Reporting is also possible to get a view of performance over time, helping to identify trends or points in time when a problem occurred or a change impacted the environment.
Citrix Application Delivery Management
Application Delivery Management (formerly MAS) provides automation, monitoring, reporting, and analytics of networking devices, such as Citrix ADC and Citrix SD-WAN.
I mentioned previously that ADM could integrate HDX Insight with Director for customers with Premium Virtual Apps and Desktops licensing. HDX Insight is a set of data collected by MAS from Citrix ADC appliances running VPN Gateway, providing insight into the HDX traffic that passes through a Gateway and to your Virtual Apps and Desktops machines.
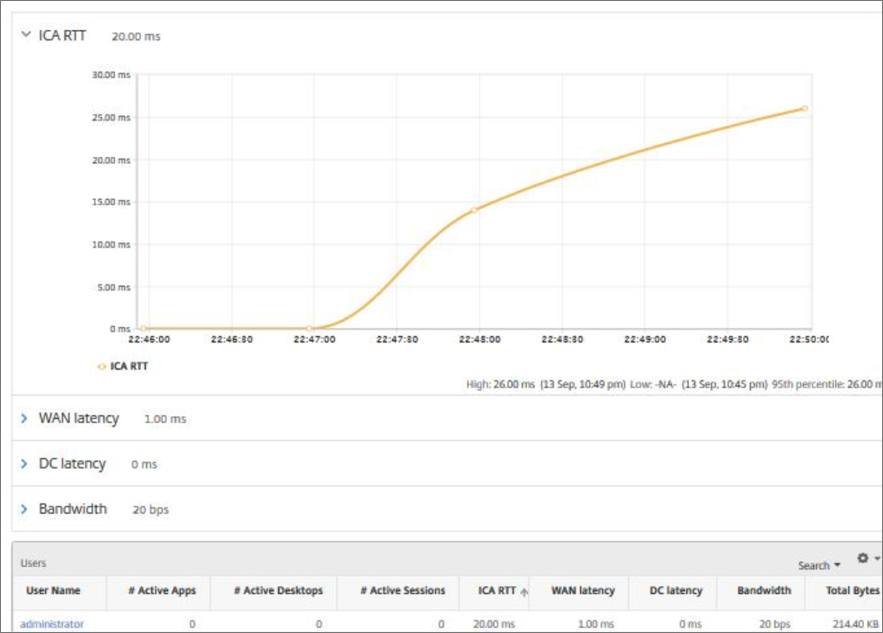 The workforce today is more mobile than ever before. Users want to access their applications and desktops wherever they are and from any device. This poses a challenge for IT supporting the organization, as IT does not have the ability to manage end user devices or the networks from which they connect. Making virtual applications and desktops accessible outside of the corporate network allows your organization to thrive, but you need to be able to support those remote connections, which is what HDX Insight can help with. With HDX Insight, you can get a view of connected users coming through Gateway, what their WAN latency is, RTT (screen lag) time, what the datacenter latency is, how much bandwidth is being consumed by the virtual channels being used for a session and more.
Setting HDX Insight aside, ADM offers more functionality and ability, such as:
- Web Insight: The ability to report on web traffic that flows through your ADC load balancers. You are fed information such as the bandwidth, hits, what web browsers are used to access the application, response time, and more.
- Backups: The ability to backup ADC instances, restore direct from the ADM console, and transfer the backups to a secondary location.
- Syslog and SNMP monitoring: The ability to collect syslog logs from your ADC instances and generate alerts based on SNMP traps received.
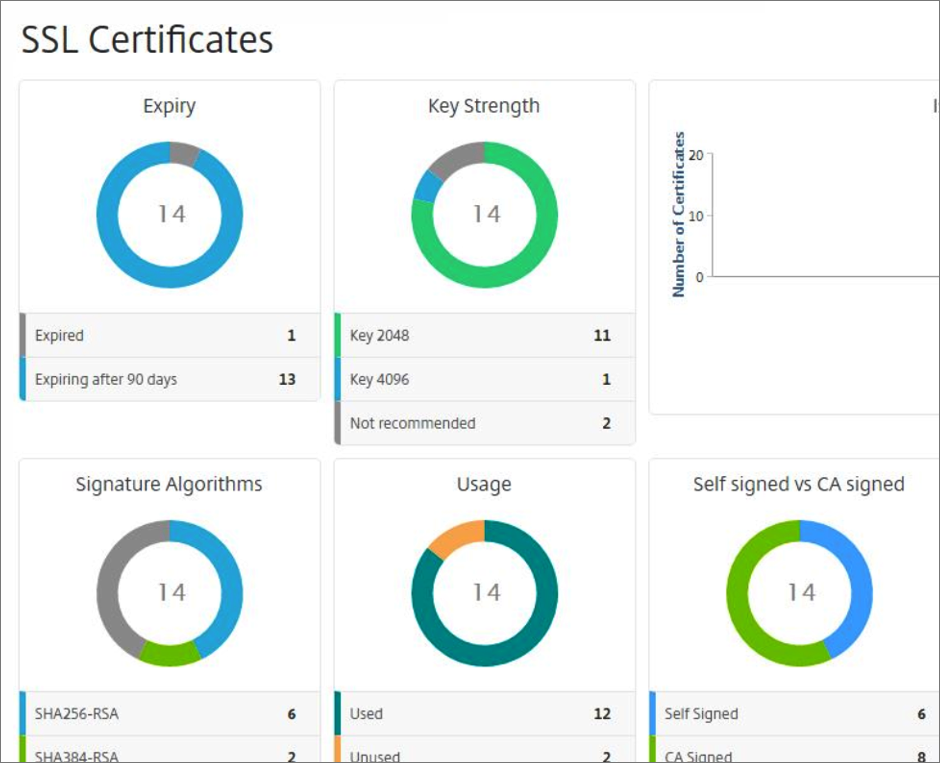
- SSL Certificates: A dashboard showing the state of SSL certificates across your ADC instances. How many are self-signed, which ones are expiring soon, what ones have weak key strengths, and so on.
There is a lot more ADM can do, if you want to read more I suggest visiting this article: https://www.jgspiers.com/citrix-netscaler-management-analytics-system/
SCOM Management Packs for Citrix
 What actually happened to the SCOM Management Packs? Nothing just yet. They are still there and available, although they will be End of Maintenance in March 2020 and End of Life June 2020.
They were actually bundled with the XenApp and XenDesktop LTSR 7.15 version and made available as a separate download for other versions. The SCOM Management Packs cover Virtual Apps and Desktops, StoreFront, and Citrix Provisioning. There were previously packs for the Citrix License Server, and XenServer, but they have already since gone End of Life.
Citrix did not see a large uptake in the SCOM Management Packs and have decided to stop development.
What will the focus of Citrix monitoring tools be?
If we take a look back at 2019, Citrix Director evolved with the most notable new capabilities:
Director Version 1906:
- Support for Session Auto Reconnect. Now, the Sessions page under the Trends tab will display information about the number of auto-reconnects.
- Session start-up duration is divided into Workspace App Session Start-up and VDA Session Start-up periods, giving you further visibility into logon time phases.
- Desktop probing, which is a Premium license feature, allows you to run automated launches of desktops. Previously Director only supported launching published applications.
Director Version 1909:
- Integration with Citrix Analytics for Performance. This is currently under Limited Technical Preview.
 |
The focus of Citrix will likely be more of the same. Providing extra capabilities within the on-premises and cloud versions of Director, such as further breakdown of the logon times and bringing Performance Analytics out of technical preview. There may be extra emphasis placed on Performance Analytics. |
Citrix Analytics for Performance
Citrix Analytics for Performance (Performance Analytics) is a Citrix Analytics Cloud Service that allows you to track and visualize key performance indicators of your Virtual Apps and Desktop deployments.
The service supports integrating multiple on-premises and cloud sites into Performance Analytics, where it takes the data from each Site and uses its advanced performance analytics capabilities to calculate performance and health scoring for easy viewing via dashboards.
There are two dashboards available with Performance Analytics, User Experience, and Infrastructure.
User Experience:
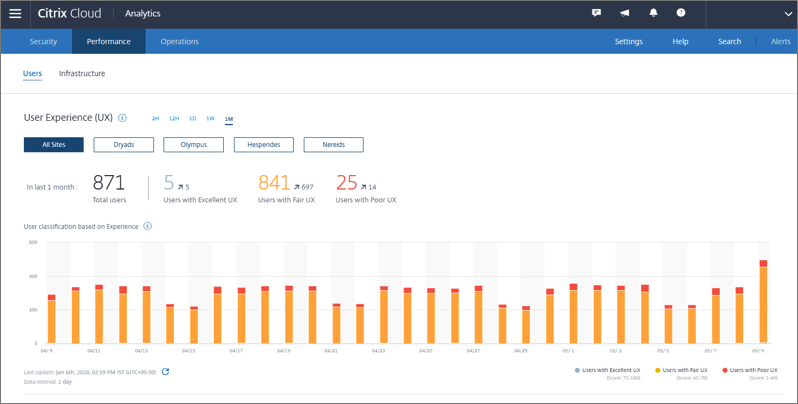
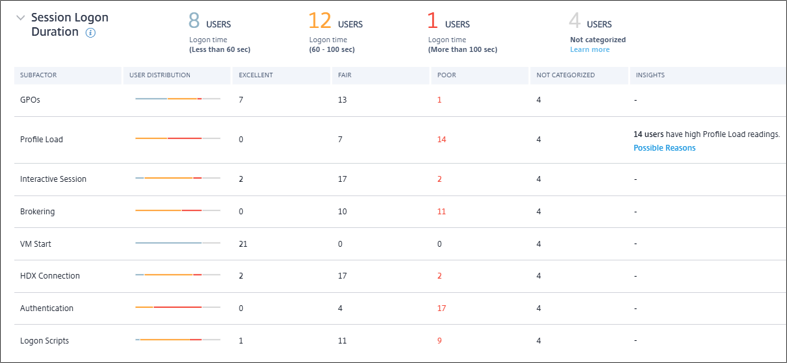
The User Experience dashboard gives you a clear, high-level view of what type of experience your end-users are experiencing. You can view the experience indicators over 2 hours, 1 day, 1 week, etc.
The UX score is calculated from different metrics measures from a user’s initial session launch until its end. Those calculated metrics that make up the UX score are:
|
|
The overall UX score for a user session is placed into one of three groups:
- Users with Excellent UX
- Users with Fair UX
- Users with Poor UX
If session responsiveness is slow or latency is high, the Session Responsiveness metric calculations will reflect that. If users struggle to establish a session or Workspace app experiences high reconnect rates due to being connected over a sluggish network, the Session Availability and Session Resiliency metrics will be impacted.
As metrics are scored, the overall make up of each metric determined the UX score.
Scrolling down the User Experience dashboard you will see other graphs, which are clickable for deeper analysis.
The graphs on the main User Experience dashboard are for metrics like session failure rates, total logons, logon duration, session responsiveness, etc. Basically, you are able to look at dashboards metric by metric. All dashboards again can be viewed over different time periods such as 2 hours, 12 hours, 1 day, 1 week.
Infrastructure:
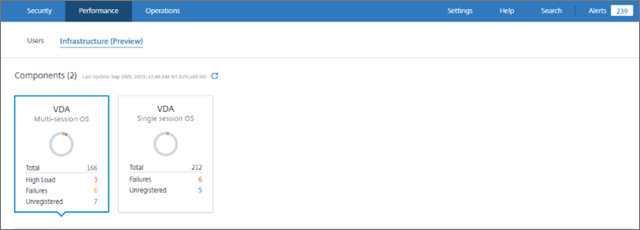
The Infrastructure dashboard provides insights into the health and performance of your VDA machines.
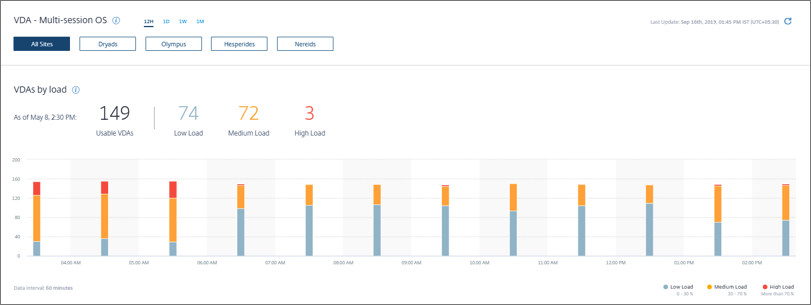
As you view the main dashboard, you can see the number of desktops across your site that may be in an unregistered state, failed state, or be under high load, etc.
As you scroll down the dashboard, different graphs display for in use/available VDAs, unusable VDAs, unregistered VDAs, VDAs in Maintenance Mode, and so on.
With Performance Analytics, there is a lot more advanced functionality not covered here, so I suggest you check out Citrix Documentation for more information if you are interested.
Who are the other Citrix monitoring tools?
There are a few different tools that are able to monitor your Virtual Apps and Desktops deployments very effectively. Many of you will already know the products from listening to community webinars and reading community blogs. A broad number of products out there can monitor virtual machine resource consumption, and the Citrix services, etc.; however, other niche products actually focus on monitoring the Citrix stack of components, analyzing logon times, and so on, incorporating Citrix-specific metrics.
Products that focus heavily on Citrix-specific monitoring include eG Enterprise, Goliath Performance Monitor, ControlUp, and Stratusphere UX. Other more generic monitoring products include SolarWinds, PRTG, Splunk, Dynatrace.
While it is difficult to predict exactly what exactly the focus will be for each product, broadly I predict that the products will look to innovate around three areas in particular:
Monitoring Citrix Cloud/Hybrid Cloud
 The Citrix Cloud space will help monitor components Citrix shift to the cloud and offer as a service. Citrix Managed Desktops (CMD) will also be an area of interest, and close attention will be paid to CMD and also Windows Virtual Desktop (WVD).
More cloud services are being adopted and more organizations find themselves utilizing a hybrid deployment of Virtual Apps and Desktops. This changes the scope of monitoring, as services fully under your control and on your hardware now reside in another organizations infrastructure and is managed and monitored by them. There is still a requirement in some cases for you to monitor the infrastructure you place in the cloud, though, like virtual desktops that reside on Azure, not to mention the network links from your offices to these cloud locations, in which some cases are dedicated.
Synthetic monitoring is also gaining traction especially as services are moved to the cloud. As you may lose visibility with infrastructure you used to manage and monitor when your desktops and application servers were on-premises, synthetic monitoring is the best way to run an end-to-end test of the entire infrastructure hosting your desktops and application servers wherever they may be.
Monitoring new on-premises components and products
 Existing on-premises Citrix components that are released to provide extra benefit to Virtual Apps and Desktops deployments.
Citrix has App Layering, Workspace Environment Management, and other components like Federated Authentication Service now available under quite popular licensing models. Many organizations across the world have deployed one or more of these components into their environments and they have become important, so there is a need to monitor them more closely as they run on dedicated virtual machines and run dedicated software outside of the normal Virtual Apps and Desktops stack.
Vendors like eG Innovations have responded to new products and features released by Citrix and developed support for them to provide specific monitoring for components, such as WEM, FAS, Local Host Cache, and so on. These are very welcomed enhancements as Citrix Director does not deal with monitoring such components at all.
In-product enhancements
 In-product enhancements will allow Citrix administrators to more effectively troubleshoot end-user issues. Products will become more user-friendly, and you can find the information you need faster. Products will also continue to support the latest versions of Virtual Apps and Desktops, released every quarter by Citrix. VMware Horizon support will also be on the agenda, as well as Hypervisor support, etc.
Adapting to changes in the enterprise
 On the other hand, monitoring as I have mentioned many times, allows you to troubleshoot issues faster and more effectively, but there have been changes in the enterprise that cause greater difficulty for effective troubleshooting. As a result, monitoring companies need to innovate in a way that helps with these changes.
The number of devices used in the enterprise today from desktop to mobile, and the different locations users connect in from day-to-day makes it more difficult for the helpdesk to support and rectify issues. Many devices are no longer managed by the organization at all, and network locations can range from high-speed private broadband to public shared internet in a coffee shop. Nonetheless, users expect the same level of experience wherever they are, and from whatever device they use, which puts pressure on IT to deliver and support.
Also, organizations find themselves upgrading Virtual Apps and Desktops environments faster than ever before to support the latest innovations rapidly released by Citrix. If you are running on a Current Release version of Virtual Apps and Desktops, you will need to update every 18 months to remain in support with Citrix. LTSR versions are more settled, however, Citrix just released the newest 7 1912 version of LTSR, which will prompt a number of organizations to begin looking at upgrading.
The problem with upgrades is that you are introducing new code and factors into the environment, likely new operating systems and maybe even new hardware. These factors have the potential to make a great user experience a poor one, if not handled correctly. This is why monitoring tools are important as they aid IT with performance baselines and help you troubleshoot faster, which can increase user adoption rates, a critical success indicator of Virtual Apps and Desktops deployments. Goliath Performance Monitor and eG Enterprise in their latest releases have focused on new dashboards and reporting that can make it easier for you to be effective in supporting Virtual Apps and Desktops deployments whether existing or upgrading.
Summary
This year is looking like another one packed with innovation from many major technology vendors like Citrix and Microsoft. That is basically a given. Monitoring is on the agenda for Citrix, but innovation focus has mostly been in Citrix Cloud, offering more and more services to customers. Citrix Analytics and Workspace have been two major areas of interest.
As the enterprise continues to shift services to cloud and end-users continually work from anywhere across many devices, Citrix administrators must continue to support these changes, which is most difficult without a monitoring solution in place.
Monitoring vendors are adapting their products, focusing on the innovation coming from Citrix, as well as the movements in the cloud. However, monitoring products are themselves coming under some facelift, with new dashboards, reports, information and actions being made available to the organizations that utilize them. The goal is to provide meaningful data and actions so that you can troubleshoot issues faster than ever before or even prevent them from spreading.
Happy monitoring!
eG Enterprise is an Observability solution for Modern IT. Monitor digital workspaces,
web applications, SaaS services, cloud and containers from a single pane of glass.


