Deploy Application and Infrastructure Monitoring to Ensure Successful Migrations and Upgrades
 Constant changes happen in today’s digital world. New versions of applications, databases, middleware, and virtualization technologies are being released regularly – at least once every 6-12 months. Patches and upgrades to operating systems and changes to anti-virus software are being released in weekly cycles rather than months. As DevOps gets adopted on a broader scale, changes to applications will be even more frequent. With agile methodologies being implemented, code rollouts can even happen every few days in production.
Often the updates are done by different personnel. The systems team handles updates of the operating system; the database team handles the database upgrade; the virtualization team takes care of upgrades of the hardware, hypervisors and underlying storage, and so on. In some cases, updates happen automatically without needing any administrator’s intervention. Application owners are often not aware of the changes that happen in each technology tier supporting their applications. Even when application owners are aware of changes being made, such as a major migration or upgrade, they may not be aware of or understand the significance of every change being made.
However, every change, migration or upgrade has the potential to affect application performance and ultimately, the experience of users of the application. For instance, an operating system update may turn on Microsoft Windows Defender, which in turn can cause additional scanning of the systems being used, thereby affecting the application’s throughput and performance. If application architects and operations teams wait for users to notice and complain, it may be too late. Business productivity, reputation and revenue will all suffer.
This is why application performance monitoring has a big role to play in today’s ever-changing environment.
How Application Performance Monitoring Helps with Migrations and Upgrades
Use external/synthetic monitoring to assess application performance before and after any upgrade/migration |
 Synthetic monitoring emulates user accesses to the application and, therefore, if there are any increase in application response times following the upgrade/migration, it means that users are likely to be affected. Proactively monitoring any such changes allows application teams to start troubleshooting the problem well in advance of user complaints.
Monitor key performance indicators (KPI) before and after the upgrade/migration to highlight bottleneck areas |
 Even if application response time looks good, there may be changes to the application usage or throughput that may not be discernable using synthetic monitoring. Hence, your monitoring strategy needs to cover as much of the infrastructure supporting the application as possible.
To highlight this, we have used a real-world application migration scenario that we were called into assist with last month. A multi-tier, Java-based web application had been upgraded recently and users were complaining about poor performance. The upgrade involved changes to the application tier alone. The web tier, the database tier, storage, etc. remained unchanged.
Monitoring of the database server (Microsoft SQL server) showed an abnormal increase in deadlocks on the database server. The application upgrade had been conducted on December 19th. The historical chart below (see Figure 1) highlights that there had been no deadlocks prior to the upgrade. However, after the upgrade deadlocks started occurring. Since there was no change to the database server, the conclusion drawn from this is that an application logic change during the upgrade resulted in the deadlocks. Deadlocks can be detrimental to application performance. So this sudden change in the database access pattern of the application needed to be investigated.
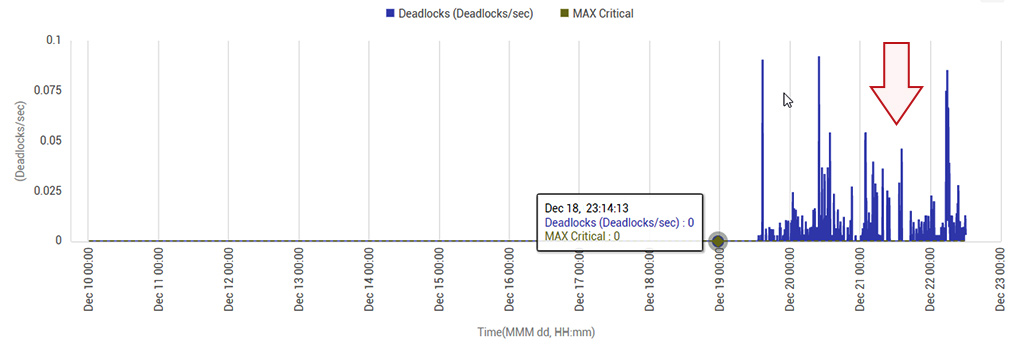
The upgrade had been planned during the holiday season, so traffic to the application was lower than normal and user perceived performance was not impacted. However, by knowing that there was an abnormality, the application team was able to diagnose the problem and fix the offending code proactively.
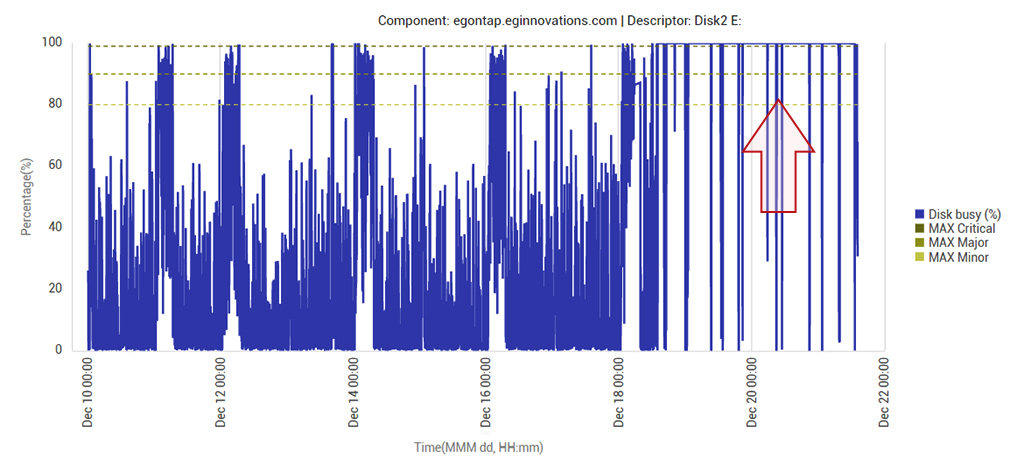
Monitoring in advance of a full deployment can also highlight resource usage pattern changes that may have been inadvertently caused by application upgrades. See Figure 2 below that shows the disk activity on the database server after the application upgrade. Notice that right after the upgrade (pointed to by the red arrow), the disk had become almost 100% busy.
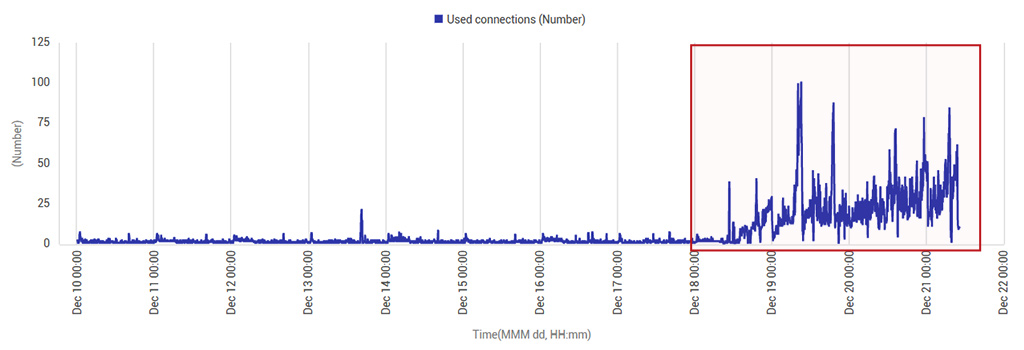
Connections to the database server also increased significantly at the same time (see Figure 3).
Monitoring such KPI changes can provide you alerts of performance anomalies right after an upgrade or migration. While the above figures point to the database server being a bottleneck, given that there were no changes to the database server, the performance anomalies introduced had to be because the new application used inefficient queries to the database server.
 Distributed transaction tracing (part of an APM solution) can be deployed to obtain further details of where the problem is in the application code. In this case, the problem turned out to be inefficient queries to the database server. The application developer had not used the indexes available in the database schema and this resulted in each query causing a full table scan of the database, affecting performance. Using an APM tool right after an upgrade allows operations teams and development teams to safeguard performance.
Other KPIs to look at post migration include changes in CPU and memory usage of the application, garbage collection performance changes, thread blocks/deadlocks, traffic patterns between applications, errors in log files, etc. Consider using a load testing tool post migration to simulate additional workload and evaluate the tier-wise performance with the help of a monitoring tool.
Track all configuration changes – at the hardware, OS, and application levels |
 Configuration changes often cause application performance issues. For instance, you may have tuned the previous version of the application for best performance and the upgrade may inadvertently undo these changes. This, in turn, will cause application performance bottlenecks. By seeing all the parameters that were changed after an upgrade, you can identify the cause of a performance bottleneck quickly.
As we saw earlier, application owners are not aware of all changes that happen. By tracking current configuration and seeing what changed on a regular basis, application owners can learn about changes that may have occurred in the ecosystem supporting the application.
Concluding Remarks
Upgrades and migrations are never as straightforward as they seem to be. Even if the upgrade/migration itself is simple, the performance changes that can occur later have to be monitored with an eagle eye. Having a monitoring tool to collect pre- and post-migration performance for comparison greatly helps ensure that the upgrade/migration has happened successfully.
eG Enterprise is an Observability solution for Modern IT. Monitor digital workspaces,
web applications, SaaS services, cloud and containers from a single pane of glass.


