Browser Monitoring in Citrix Infrastructures
A couple of application deployment and usage trends are causing interesting performance monitoring challenges in Citrix infrastructures:
- Citrix XenApp and XenDesktop are used to host client applications that users access through thin clients. With a lot of the corporate portals and intranet applications being web-based, one of the most widely used client applications on Citrix infrastructures is the ubiquitous web browser. SaaS applications like Salesforce and ServiceNow are accessed using the browser.
- A second key trend is that web applications are being designed to use client-side scripting (JavaScript, Ajax, etc.) for rendering and processing of information.
On a Citrix infrastructure, since browsers are hosted on the Citrix servers, client-side processing uses CPU, memory and disk resources on the Citrix servers. Any script malfunction or errors can cause the corresponding browser instances to take up excessive resources.
When users had physical desktops, a browser instance taking up CPU, memory or disk resources would only affect the performance seen by the corresponding user. However, since a Citrix server is shared by multiple users, one user’s browser instances taking up excessive resources can affect the performance seen by all other users of the same server. Therefore, identifying and fixing browser performance issues is a key challenge for Citrix administrators.
Most Citrix performance management tools report on the resource usage by applications running on the Citrix servers. With this approach, an administrator can see that specific browser instances are using excessive resources but they will not be able to determine why – i.e., which URLs or web sites are being accessed by browser instances that take up excessive resources?
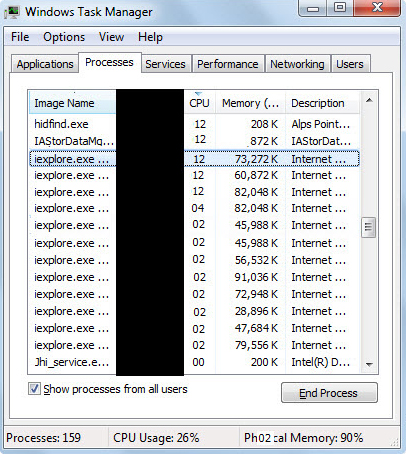
 To illustrate this further, look at the figure below which shows a snapshot of Windows Task Manager showing the processes running on the server. From here, an administrator can see that certain browser instances are taking up excessive CPU but not which URL is being accessed by that instance.
eG Enterprise v6 maps browser instances to the URLs/web sites being accessed. This allows administrators to easily determine when a browser instance is taking excessive CPU or memory or is causing high IOPS on the server, which URL/web site is the user accessing.
To illustrate this capability, consider the figure below which shows the users currently logged on to a Citrix XenApp server and the resource usage and bandwidth usage for each session. As is evident, the user Charles’ session is consuming more bandwidth than the others and his session is also consuming 85% of the CPU of the server.

eG Enterprise’s detailed diagnosis capability provides more details on why charles’ session is consuming excessive resources. In the figure below, you can see the applications that this user is running. From the table below, it is clear that the user has three browser windows (or tabs) open and the process consuming CPU is “Internet Explorer” with PID 3566. From the browser title, it is clear that the user is watching a movie from www.youtube.com!
This information helps Citrix administrators track the usage of their Citrix servers, watch for unexpected usage on their servers and track down users who may be accessing non-corporate applications and may be affecting the performance seen by other Citrix users.
PS: A mapping of process ID to URL is available only for Internet Explorer on Citrix XenApp and XenDesktop.
Learn more about IT infrastructure monitoring »
eG Enterprise is an Observability solution for Modern IT. Monitor digital workspaces,
web applications, SaaS services, cloud and containers from a single pane of glass.


 Babu is Head of Product Engineering at eG Innovations, having joined the company back in 2001 as one of our first software developers following undergraduate and masters degrees in Computer Science, he knows the product inside and out. Based within our Singapore R&D Management team, Babu has undertaken various roles in engineering and product management becoming a certified PMP along the way.

