What is Citrix Cloud?
There are an increasing number of organizations, who are moving their Virtual Apps and Desktops deployments to Citrix Cloud by using the Virtual Apps and Desktops service. Citrix Cloud allows you to host components such as your core management layer for a Virtual Apps and Desktops deployment in the cloud, managed and kept up to date by Citrix.

Do You Need Monitoring Tools for Citrix Cloud?
| One question I have heard asked a few times surrounding the Citrix Virtual Apps and Desktops service is “Do I still need to keep the monitoring products I used for my on-premises deployments?” The short answer is of course, you do, or, yes you should keep them. |
 You might be wondering why exactly I am saying yes, because as you know, the Delivery Controllers, SQL databases, license server, and so on are monitored and managed by Citrix themselves 24/7. Other than a Service Heath Dashboard, you don’t really have any insight into the health of these components.However, your VDAs, application data, profile data, and other core components are still fully within your control. So, the answer becomes clear, you still do need monitoring products that have been purpose built for Citrix deployments. Having them will allow you to proactively monitor and troubleshoot end-user issues just like you have always done in the past.
Managing on-premises vs. Citrix Cloud deployments has to be done a similar manner. You have a very similar toolset, just hosted in different locations like the services themselves. So instead of launching Citrix Studio locally on a management server, or directly from the Citrix Delivery Controllers, you have a cloud-hosted Citrix Studio accessed from the Citrix Cloud portal over HTML5. There is also no longer an on-premises license console, or Citrix Director. These management consoles have been moved to Citrix Cloud. For products you continue to host such as Citrix Provisioning, you will need to continue to use the local console on Provisioning servers.
10 Common Issues You Could Experience When Using Citrix Cloud
1. Slow User Logon Times
- Group Policy
- Logon scripts
- Profile storage and solutions
- Hypervisor CPU, RAM, Storage
- VDA specifications
A number of these listed items have the potential to impact logon times. For example, logon scripts or Group Policy Preferences mapping network drives to a network path that is not reachable. This can add numerous seconds on to the logon time for an end-user. Another example is VDAs that have not been spec’ed accordingly. Maybe there is not enough CPU to deal with the number of logons a shared server OS is tasked with processing during busy periods of the morning.While with a Virtual Apps and Desktops service deployment, we still have Citrix Director hosted on the cloud, other purpose-built Citrix monitoring solutions can provide more in-depth information around logons and where the slow points are.
2. Citrix VDA Failures
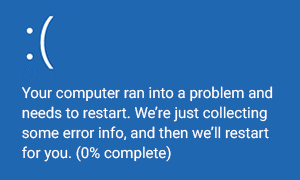 Citrix VDAs can fail for several reasons. One common scenario I come across is when VDAs are rebooted nightly or weekly on a schedule. At times, one or two VDAs do not come back online.Other reasons can be due to a VDA crashing, maybe under load or due to a system/software issue that causes a crash. The VDAs can also lose IP configuration, or lose their network configuration, which causes them to lose contact with the Delivery Controllers and stop accepting connections.
When VDAs fail, there could be a couple of issues raised as a result:
- If the VDA is a static VDA, an end-user may be logging a ticket with the help desk to report they cannot connect to their desktop.
- If the VDA is a random-pooled desktop or server, there is now a smaller pool of available VDAs and resources, to deal with your user load. This might be OK in many situations, unless multiple VDAs have failed, which can be quite possible if a network issue is encountered at a particular data center or on a particular host, or there are storage issues.
To avoid VDA failures, again Citrix Director has the ability to report on VDAs that are unregistered with a Delivery Controller. The benefits of having a monitoring solution to back this up is that it can tell you the reasons why this has happened, such as storage failure, network issues between VDAs and Delivery Controllers, Hypervisor host failure, etc.
3. Network Connectivity Issues
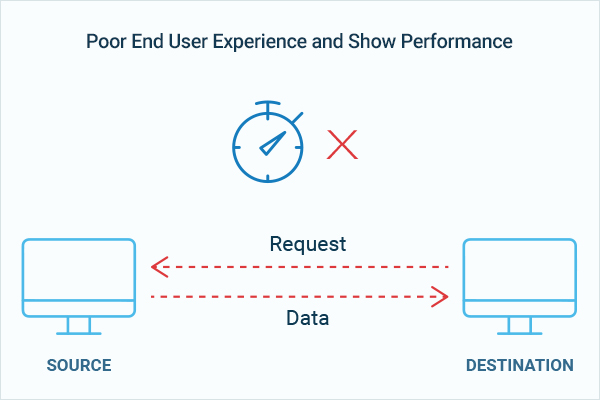 Whenever we have a well-performing network end to end, our end-users benefit from minimal retransmits and in most cases, lower latency.In today’s world, with remote working more common than ever and showing no signs of slowing, we serve virtual apps and desktops to users over all kinds of different networks. We have high speed networks, slow networks to rural areas, public networks and so on, and they all have different characteristics that constantly change.
With the move to Citrix Cloud, extra latency can be introduced to an ICA session depending on certain variables, such as if you deploy StoreFront within your resource locations, and if you make use of the Citrix Gateway service for remote access to your apps and desktops.
As covered in my other article linked here, the ICA traffic flow changes if you enable remote access to your apps and desktops using the Gateway service. This traffic flow can be controlled using the Rendezvous protocol or Direct Workload Connection (formerly Network Location Service).
Either way, we still need a monitoring product that can capture ICA RTT (Round Trip Time) and of equal importance, store it historically. It is by leveraging this RTT data that we can investigate “Citrix is slow” type reports at the help desk and figure out why the connection is slow, e.g. is it something on the end-users side, or something at the Resource Location, or within Citrix Cloud’s control plane.
An example can be, have you sufficient bandwidth to the cloud? Or have you the right information to determine if network latency or network packet loss between your location and Citrix Cloud is actually an issue on the Citrix Cloud side or not.
Monitoring solutions purpose-built for Citrix, like eG Enterprise can also track latency and bandwidth consumption right down to the individual ICA channel level, giving you even more ability to troubleshoot session slowness and potentially detect where a particular workflow is underperforming due to a required virtual channel being capped.
4. Citrix Application/Desktop Availability Issues
Our applications and desktops need to be available at all times. With the ability to work from anywhere, it is much more common now for end-users to not have a set working pattern. For example, some staff may decide they need to catch up on a bit of work so they may log on after hours, or they may work different shifts each week.Basically, you will want to monitor the availability of your applications and desktops 24/7 and be made aware of when they are not available for the many reasons that can be.
With a Citrix Cloud deployment, your VDAs still remain within your control in your Resource Locations, so they still have the same capabilities of failing like they always have. That has not changed. For example, your VDAs can fail to register with the Cloud Connectors within your resource location, just like they could with on-premises Delivery Controllers.
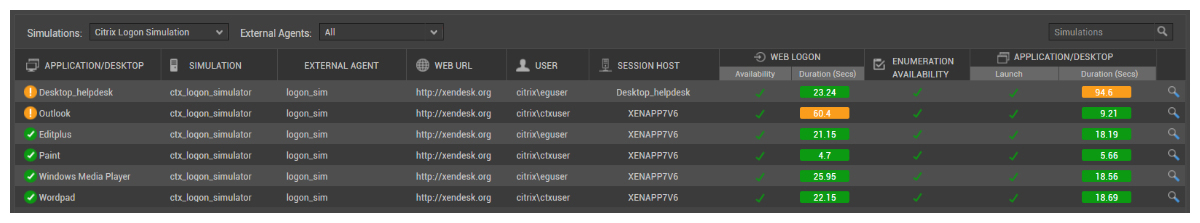
With a monitoring solution that can continuously launch applications and desktops like an end-user would, not only do you test that the applications and desktops are available, but also the infrastructure required to make the connection work.From Citrix Cloud, you can do just this using Application probing or Desktop probing. The third-party solutions available today (like the eG Citrix Logon Simulator) also have this ability, and often offer more detailed information, screenshots of each of the probe steps, and more customizable test schedules. Some third-party products (e.g., eG Enterprise Full Session Simulation)” even go beyond the launch and can run specific workflows, such as clicking within the application to test its functionality.
5. VM Resource (RAM, CPU, Disk Space, etc.) Limitations
 The core components you will monitor on all your VMs is RAM utilization, CPU utilization, and disk space for each logical drive and the up/down state. It is very common that from time to time, VDAs will encounter high CPU or RAM utilization due to a runaway process, or a user running a report or another intensive task that impacts that user and potentially other users, if it is a shared VDA. Disk space and the up/down status are other common problems you face.As each VDA in your environment is likely to run non-persistently, extra attention needs to be paid to the Write Cache overflow disk that you use to store writes to the VM, should the RAM overflow fill up. By monitoring the Write Cache drive, you can prevent VMs from hanging should that drive run out of space.
You also want to capture CPU and RAM utilization to help prevent session slowness and slow logon times. By implementing such monitoring, you can determine if VDAs need extra computation? to handle logon storms, or a particular user workload within your organization.
Not only do you want to track these metrics on all your VDAs, but also the Cloud Connectors within each of your resource locations, your AD Domain Servers, DHCP servers, DNS servers, and any other server that is used in production.
6. Domain Name Service Issues
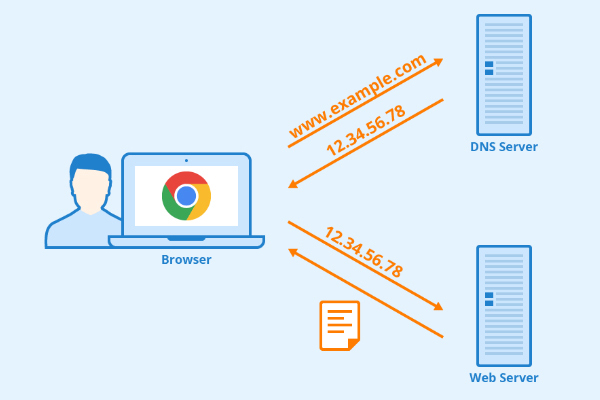 DNS is a critical part of your infrastructure. If DNS is down, or VDAs are having issues resolving DNS, there will potentially be a lot of impact.DNS can fail in different ways. However, one of the most common is simply network related. For example, a VDA cannot reach the DNS servers. The traffic is getting so far, but not far enough for a response to be received. Soon after, the cached record will expire, if the record is indeed cached, and that is when problems begin.
As such, you will want to monitor not only your DNS servers and their health, which is most important, but the VDAs, Cloud Connectors, StoreFront servers, ability to resolve DNS. If DNS resolution begins to fail on one or more of the servers within your control, you should be notified through advanced alerting.
With a Citrix Cloud deployment, each of your resource locations will have a pair of Cloud Connectors, which act as the gateway to the Citrix Cloud control plane. If DNS resolution for these VMs are failing, your users will not be able to establish new connections to their apps and desktops, unless you have locally deployed StoreFront servers and can make use of Local Host Cache.
Other service impacting issues that can arise from DNS resolution failures can include VDA logon failures due to authentication with Domain Controllers failing, VDAs losing access to Delivery Controllers and thus registration, profiles not loading whenever profiles are stored on a remote share.
7. Citrix Provisioning Issues
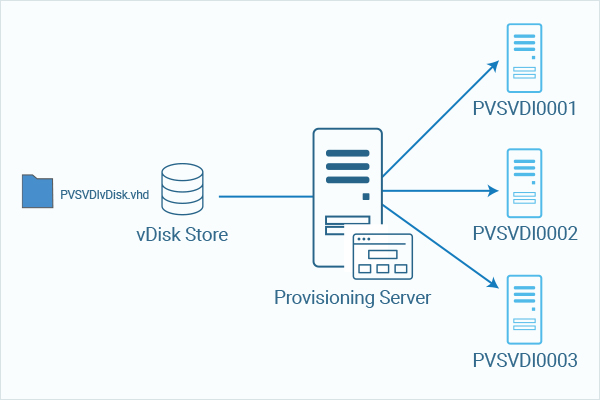 The majority of Citrix customers have or continue to use Citrix Provisioning to rapidly scale their VDA infrastructure and maintain image integrity through single virtual disks (vDisks). This technology makes it much easier to manage multiple VDAs that serve the same purpose to your end-users.A Virtual Apps and Desktops service deployment on Citrix Cloud does not include Citrix Provisioning. You must continue to host Citrix Provisioning servers at your resource locations.
Provisioning servers, in my experience, are fairly robust. However, if the Stream service was to fail, for example, VDAs would failover to another Provisioning server if one was available based on your vDisk load balancing setup. This is fine as a short-term solution. However, it is something you will want to address sooner rather than later.
As such, the same monitoring applied before still stands. You will be monitoring critical services, such as the Stream and Soap services, and database connectivity to your local SQL server.
8. Citrix Cloud Connector Problems
As mentioned previously, Citrix Cloud Connectors are installed on each of your resource locations, in pairs for HA and load distribution. Cloud Connectors have a range of duties including:
- Power managing VDAs at your resource locations
- Accepting registration requests from VDAs
- Sending traffic securely from your resource locations to Citrix Cloud
- Creating machine account in AD when using MCS

As you can tell, the Cloud Connector plays a very important role in your Citrix Cloud deployment and must be monitored closely. If all Cloud Connectors within a resource location cannot communicate with Citrix Cloud for any reason, you may encounter a multi-user outage depending upon the problem and what other technologies you have in place.The Citrix Cloud web console can be used to view the health of your Cloud Connectors. However, you will want traditional monitoring products to provide more granular information and reporting statistics for things such as RAM, CPU and Disk consumption, services health, Internet connectivity, DNS resolution, and more.
9. Citrix Gateway Issues
When it comes to a Citrix Virtual Apps and Desktops service deployment, you have two options for enabling remote access to your apps and desktops for your employees: the traditional Citrix Gateway or the Citrix Gateway service.The Citrix Gateway service is hosted and managed by Citrix on Citrix Cloud. The traditional Gateway, on the other hand, is as usual hosted within your resource locations and fully managed by you.

To support remote workers, you need to understand what type of experience they are having when working from home or from a public place. This can be achieved by using third-party solutions that are able to see HDX traffic end-to-end as it flows between the user device and VDA, through the Gateway appliance. These solutions can uncover scenarios where an end-user has a slow network connection into the on-premises datacentre hosted Gateway, or equally to a Gateway service PoP, which there are multiple hosted in AWS or Azure.Such solutions are then able to calculate latency such as WAN latency, data center latency, and overall ICA RTT, which helps you and your IT analysts troubleshoot “Citrix is slow” type reports that are commonly logged with the help desk.
10. Supporting Infrastructure Issues
 Lastly, to make a Citrix environment work effectively whether it be on-premises or hosted on Citrix Cloud, there are many supporting infrastructure components that need to be working optimally to keep your applications and desktops available and responsive for end-users to connect.Infrastructure components, such as DHCP servers, Active Directory servers, Group Policy, file servers and so on play a part in delivering apps sessions to end-users.
Because there are different components at play, there is a higher chance that one of these will encounter a problem periodically that needs to be addressed in a short space of time. Examples include DHCP scope exhaustion when no more IP addresses are available to hand out to VDAs, or when a file server is experiencing high-disk utilization, particularly during peak times, which causes profiles to load slowly and user logons to spike.
When you embark on your Citrix Cloud journey, the monitoring of these services does not change. They need to be monitored by the traditional monitoring solution so that you can proactively troubleshoot issues before they have a wider impact on your environment and ultimately end-users.
eG Enterprise is an Observability solution for Modern IT. Monitor digital workspaces,
web applications, SaaS services, cloud and containers from a single pane of glass.
Conclusion
| Whenever you begin to plan your move to Citrix Cloud, if you have not done so already, it is important not to neglect your monitoring strategy. |
As I have discussed throughout this article, many components move up to Citrix Cloud and it is the responsibility of Citrix to keep them healthy and operating optimally. However, there are still equally many core and critical services that exist within your resource locations and your remit, and thus monitoring still plays a vital part in the delivery of any Virtual Apps and Desktops deployment.
eG Enterprise is an Observability solution for Modern IT. Monitor digital workspaces,
web applications, SaaS services, cloud and containers from a single pane of glass.