End to End Monitoring of Citrix Workspace Environments
In a previous post, we discussed the capabilities and functionalities of Citrix Director, a built-in monitoring tool that is available as a part of Citrix XenApp and XenDesktop deployments. While Citrix Director provides high-level analytics about user sessions, user logon information and logon time breakdowns, connection failures, etc., is it designed to be the end-to-end, single-pane-of-glass performance management solution for Citrix Workspace environments?
In this blog, we will discuss how far Citrix Director goes for XenApp monitoring and XenDesktop monitoring and what other monitoring, analytics, and reporting capabilities are needed to provide complete end-to-end Citrix performance assurance. In this blog, eG Enterprise from eG Innovations has been used as an example to highlight areas where third-party monitoring tools augment the built-in monitoring capabilities of Citrix XenApp and XenDesktop with enhanced telemetry, deeper insights, and actionable Citrix user reports.
How Do Third-Party Citrix Monitoring Solutions Complement Citrix Director?
Synthetic Monitoring of Citrix Service Availability and Performance
 Synthetic monitoring refers to the ability to simulate user sessions to the Citrix farm. Typically, these simulations are run 24×7 and highlight times when the Citrix farm is not performing to expectation.
Citrix Director: Starting with Citrix XenApp and XenDesktop 7.18, Citrix Director supports a simplistic form of synthetic monitoring. Application probes can be configured in Citrix Director to launch applications through Citrix StoreFront. Using StoreFront APIs, these probes check if applications can be launched successfully. If the same application must be tested frequently (say once an hour), a separate probe needs to be created for each hour. Further, application probing does not work for external access through Citrix NetScaler.
eG Enterprise: Synthetic monitoring with eG Enterprise goes beyond using APIs. Actual clients that end users employ to access Citrix workspaces are used. Administrators can choose between two forms of synthetic monitoring.
- Logon simulation: Administrators provide the NetScaler/StoreFront URL and user credentials. Using scripting APIs of the web browser, the Logon Simulator emulates the exact same process that a user goes through when logging in – i.e., logging into NetScaler/StoreFront, choosing the application/desktop of interest and launching it through Citrix Receiver. Application/desktop availability and launch time are reported. The logon simulator is simple to set up and can be deployed from one or more locations.
- Full session simulation: To get a true benchmark of user experience, eG Enterprise also supports a full session simulation capability. Administrators can record a full sequence of interactions with the Citrix service and an agent replays the entire session periodically. While logon simulation stops with just the logon process, full session simulation simulates user interactions with applications after the Citrix session is established as well. The success of the entire session and the response time at each step of the simulation are reported.
Granular Visibility into Citrix Real User Logon Access
 Slow logons have been one of the biggest performance challenges that Citrix admins have had to deal with. Citrix admins need to be able to see a breakdown of logon time into different steps (e.g., Active Directory authentication, logon script execution, GPO processing etc.) to understand why logon is slow for a user.
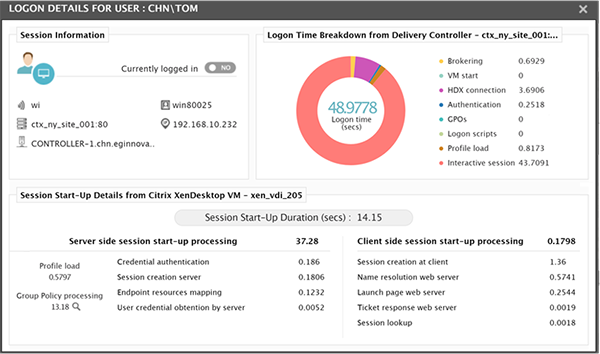
Citrix Director: Using instrumentation available at the Delivery Controller level, Director provides a breakdown of logon time – into Brokering time, VM start time, HDX connection time, Authentication time, GPO, logon script execution, profile loading and interactive session time. This breakdown is useful but there are two main limitations. Starting from release 7 1808 of Citrix Virtual Apps and Desktops (new names for Citrix XenApp and XenDesktop) Director provides additional visibility (which was missing in earlier versions) of GPO processing. Admins can now see the time taken for apply each Group Policy Object during logon and can identify which one is causing slowness. The visibility gap with Director is when Citrix Workspace Environment Management (WEM) is used to speed up logon. Director does not track the different processing tasks performed by WEM.
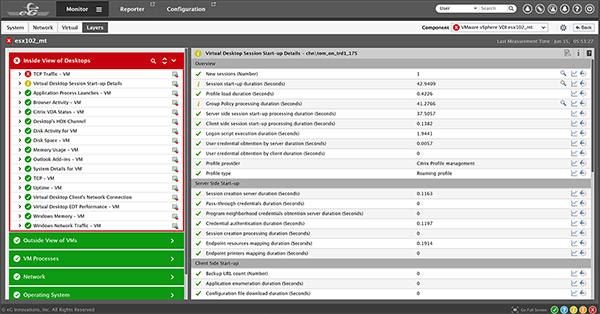
eG Enterprise: While Citrix Director provides insights into processing times as seen by the Delivery Controller, what it lacks is the insight into the different steps performed on a XenApp server or on a XenDesktop VM to process user logon. Logon processing time obtained from a XenApp server or a XenDesktop VM helps differentiate server-side processing time from client-side processing time. Furthermore, the processing time for each Group Policy client-side extension on the server-side can be reported. This helps immediately address any Group policy processing issues. Profile size information and large files in the profile are also reported to assist with logon optimization. Integration with Citrix WEM is also used to report WEM processing time. Slowness in WEM processing can also impact the user experience because users may find that they don’t have access to their profile or files after they logon to their virtual desktops. All these capabilities help Citrix admins go beyond the logon monitoring capabilities of Director to accurately troubleshoot logon slowdowns.

Centralized Monitoring of The Entire Citrix Delivery Infrastructure
 The Citrix delivery infrastructure includes several different tiers – NetScalers, StoreFronts, XenApp servers, Provisioning servers, License servers, XenMobile, XenServers, WEM servers, etc.
Citrix Director is focused on monitoring XenApp servers, XenDesktop VMs and sessions running on them. To get a unified, end to end view of the Citrix tiers, administrators need to use other monitoring/administration consoles. The need to use separate consoles for each of the Citrix tiers makes problem diagnosis very manual and time consuming.
eG Enterprise provides a single central console from where administrators can track the health of all the Citrix tiers. Having a single consolidated view makes it easy to detect and resolve problems.
Unified, Contextual Visibility of The Supporting Infrastructure Tiers
 Citrix service delivery often depends on other parts of the infrastructure including network devices, Active Directory, virtualization, storage, cloud, etc. Bottlenecks in any of these tiers affects Citrix performance.
Citrix Director does not provide any insight into the performance of any of the non-Citrix tiers supporting the digital workspace services.
eG Enterprise is a total performance monitoring solution for Citrix. From one single web console, administrators can track the health of all the supporting tiers – network, storage, AD, database, virtualization, cloud, etc.
Embedded Domain Expertise
 The depth of monitoring often governs whether a monitoring tool is effective or not. For example, suppose one of the applications on a XenApp server is leaking OS handles (e.g., it is opening file objects but not closing them). Over time, handle leaks cause slowness on the servers and will ultimately bring the server to a halt. To be effective, the monitoring tool must detect and report such anomalies.
Citrix Director focuses on monitoring just the key metrics. For the tiers it monitors at the server OS level, it collects CPU, memory, and disk activity information only. OS handle growth, for example, is not reported.
eG Enterprise includes hundreds of key metrics in pre-defined monitoring models and intuitive dashboards for all the tiers supporting the Citrix service. An example of eG Enterprise’s depth of monitoring is its ability to not just show browser accesses in Citrix sessions but to actually indicate which URLs are being accessed in each Citrix session.

Machine Learning Intelligence for Auto-Baselining and End-to-End Performance Correlation and Root Cause Diagnosis
 Alerts on metrics are based on the violation of thresholds. Manual configuration of thresholds is time-consuming and requires expertise to get right. Furthermore, a problem in one tier often results in alerts from multiple different tiers (e.g., a virtualization bottleneck can affect all the tiers hosted on it including XenApp, StoreFront, NetScaler, etc.). This makes it challenging to identify the root-cause of a problem.
Citrix Director: Alerts on metrics in Director are also based on the violation of thresholds pre-configured manually. Furthermore, Director does not have any visibility into the end-to-end topology of the Citrix service. Administrators have to manually correlate metrics in Director with other tools and determine where the root cause of problems lie.
eG Enterprise embeds machine learning capability to auto-baseline a Citrix infrastructure. Built-in monitoring intelligence auto-computes thresholds of metrics based on their past history. This way, administrators are not required to manually define thresholds for each and every metric. eG Enterprise also incorporates automatic correlation and root cause analysis technology. Considering application-to-application, application-to-VM, and VM-to-physical machine dependencies, eG Enterprise automatically correlates performance across the different tiers and pinpoints where the real root cause of a problem lies. This saves administrators many hours of time manually analyzing data and trying to identify the root cause of problems. An automatically mapped service topology map helps visualize dependencies between Citrix and non-Citrix tiers in real time.
Extensive Citrix User Reports
 The utility of a monitoring tool goes beyond just troubleshooting problems. Historical analysis and reporting provides information for compliance reporting, for right-sizing and optimizing the infrastructure, for post-mortem diagnosis and for intelligent capacity planning.
Citrix Director has a minimal set of built-in reports. Administrators can create custom reports of many types. However, they will need to have the expertise to write database queries to create the report from Director’s database.
eG Enterprise includes extensive built-in reporting capabilities. Reports are tailored for specific domains as well as for user personas. Administrators do not have to write database queries to get these reports. Built in Citrix user reports include user session reporting, analysis of slow logons, application launch time analysis, top resource consuming applications reporting, user active/idle time tracking, capacity planning, right-sizing, and forecasting.
Integration with Service Desk Tools
 When problems are detected, IT admins must take immediate action. Many organizations use service desk tools for managing and tracking incidents. Citrix monitoring must be integrated with such systems.
Citrix Director is a standalone tool. It does not have any native integration with ITSM tools, ChatOps tools, orchestration tools, etc.
eG Enterprise supports native integration with ITSM tools. This integration enables automatic ticket creation in the helpdesk based on problem alerts in eG Enterprise. There is also native support for integration into Microsoft SCOM. HipChat and Slack are some of the supported ChatOps platforms.
Licensing Requirements
 Citrix Director requires Citrix Platinum licensing for long-term data storage and analysis. While Citrix Platinum customers can track historical performance for up to a year, Citrix Enterprise customers have access to only 30 days’ worth of historical data.
eG Enterprise does not require Citrix platinum licensing. Customers using Citrix Enterprise or Advanced versions can still benefit from eG Enterprise’s end-to-end Citrix monitoring capabilities.
Some Performance Problems Not Captured by Citrix Director, Which eG Enterprise Detects
- Which Group Policy Client-Side Extension is taking high processing time and slowing down Citrix logon?
- Is Citrix slow because of a bottleneck in the supporting storage or virtualization infrastructure?
- Why is the user complaining of slowness? Is there an issue in their network connection to the Citrix farm, in the line speed, or is he/she using excessive bandwidth and on which virtual channels?
- Which user is consuming high CPU and which applications are they accessing?
- When are browser instances taking CPU? which web URLs are being accessed by users?
- Are the hypervisors sized correctly? Is any VM over- or under-utilized?
- Is any backend application performance issue affecting the user experience?
eG Enterprise is an Observability solution for Modern IT. Monitor digital workspaces,
web applications, SaaS services, cloud and containers from a single pane of glass.
Conclusion
In a nutshell, Citrix Director is an ideal tool for Citrix experts to use. Besides monitoring key performance metrics, they can also initiate control actions from Director itself. Helpdesk personnel can also use Director to zoom into a specific user’s session.
At the same time, effective monitoring of Citrix workspaces requires end-to-end, correlated visibility – across the entire Citrix stack and including the infrastructure tiers that support the workspace service. This is where third-party monitoring solutions complement Citrix Director. This allows Citrix administration teams to accelerate problem diagnosis and prove it’s not Citrix that is the root cause of issues.
eG Enterprise is an Observability solution for Modern IT. Monitor digital workspaces,
web applications, SaaS services, cloud and containers from a single pane of glass.


