User Experience defines the Success of Citrix Virtual Apps and Desktops Deployments |
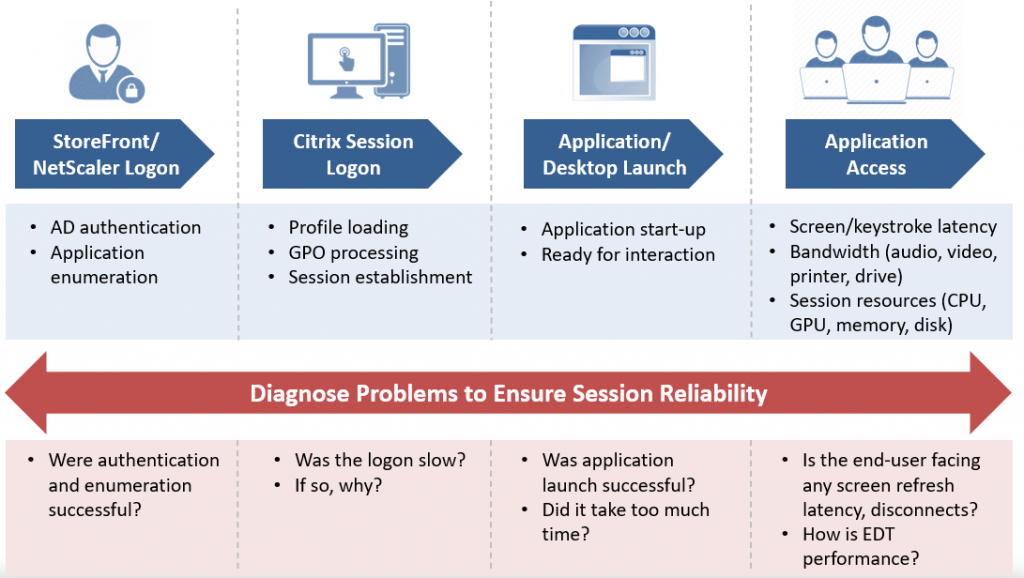
 User experience is the biggest and most important factor in determining the success of Citrix rollout in an organization. When end-users are happy with their virtualized applications and desktops, then everything is hunky dory and Citrix admins can focus on operations and maintenance. But when users are impacted due to, say, slow logons, session disconnects, slow screen refresh, etc., then as Citrix admins, you’d need to spend time troubleshooting the problem that is affecting user session access.
User experience monitoring is essential so you can see what experience your users are getting when they access the Citrix service. One way to monitor user experience is using synthetic monitoring. With synthetic monitoring, you will need to deploy software robots that simulate user activity from different locations. These robots run 24×7 and hence, they provide on-going assessments of user experience. Synthetic monitoring provides you proactive alerts on slowness or availability issues – e.g., if your Citrix logon fails at 3am, you will get to know about this even when real users are not accessing your Citrix service. At the same time, synthetic monitoring does not replace the need to monitor real users.
Monitoring of Real Citrix User Experience |
Monitoring of real user experience must be done by passively tracking user sessions. User sessions can be tracked using a client-side agent, using a network probe, or using agents deployed on Citrix virtual app servers and virtual desktops.
eG Enterprise uses agents deployed on virtual app servers and desktops to track real user activity. User experience is measured at every stage of the user session.
Citrix Logon Time Monitoring and Diagnosis |
Citrix logon is considered the most important part of the session. eG Enterprise provides in-depth insights into logon performance. Logon performance insights are gleaned both from the Citrix Delivery Controller and from the Virtual Apps/Desktops.
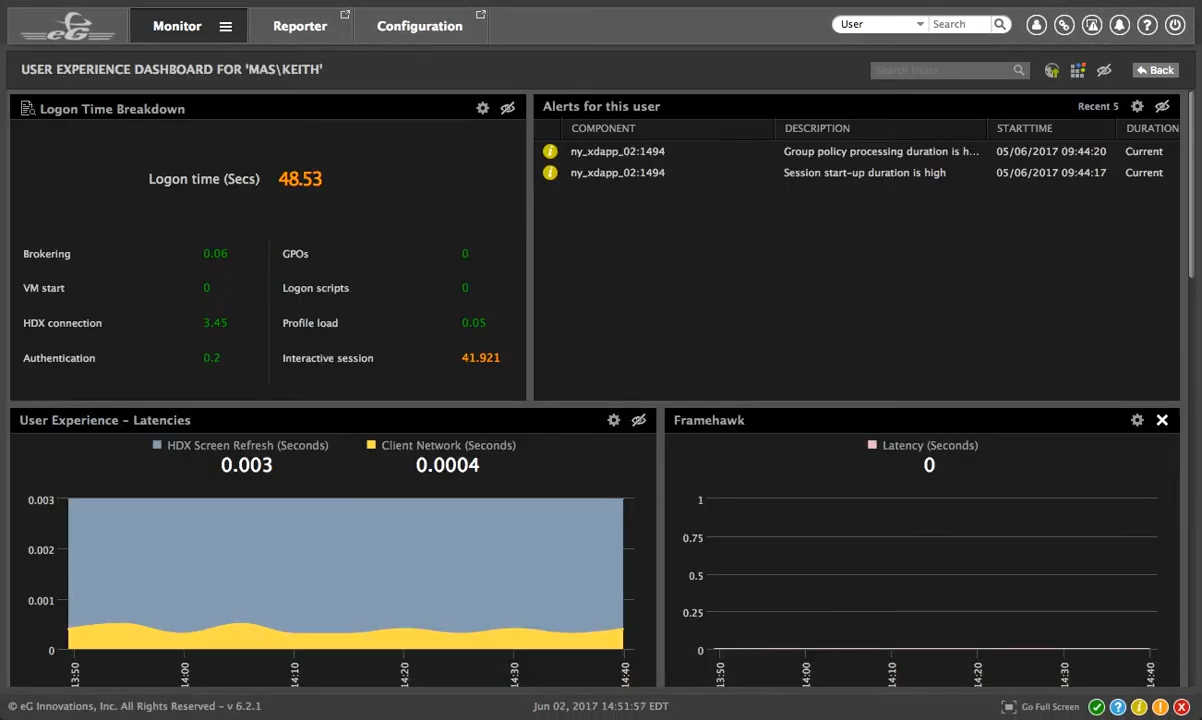
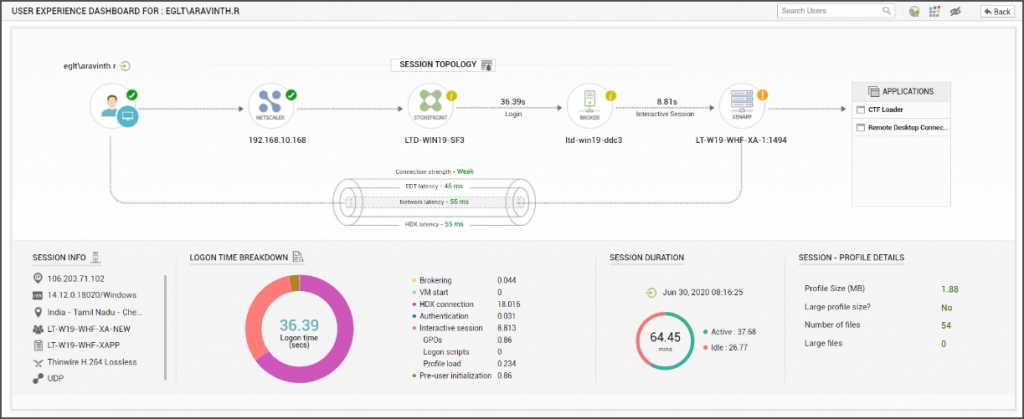
- From the Delivery Controller, eG Enterprise tracks the overall logon time as well as details including brokering time, VM start time, etc. The Delivery Controller is also where logon failures are registered. So eG Enterprise tracks connection failures at the Delivery Controller as well.
- The Delivery Controller does not have insights into all the steps performed by the VDA/VDI during logon. Hence, eG Enterprise agents on VDAs/VDIs obtain additional insight into the logon process. Time spent creating the session on the server, logon script execution time, profile loading time, GPO processing time etc. are tracked, so a 360 degree view of logon performance is provided and additional details are provided to highlight where the slowness during logon processing may come from.
Application Launch Monitoring |
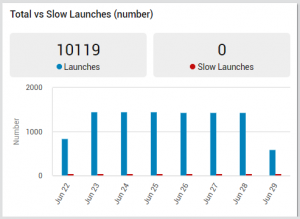 Once the user has logged in, he/she will access applications. When an application is clicked, how long does it take to become accessible to the user? This is the application launch time and for good user experience, the launch time should be only a few seconds at most. Issues with application libraries/DLLs, plugins added to applications (e.g., browser plugins, Microsoft Outlook add-ins etc.) are some of the reasons why applications may be slow to launch. Resource issues on the server can also cause slow launches.
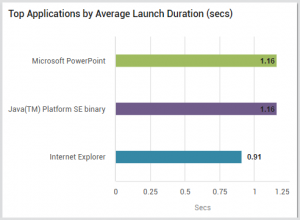 eG Enterprise agents use Microsoft Windows APIs to track application launch times for each application access. By comparing launch times for the same application across servers, administrators can determine if application launches on specific servers are slower than on others. Comparison of launch times across application versions can also help identify if the slowness is due to specific versions of the client application. Monitoring top resource consumers around the time when an application was launched may also reveal if application launch is being slowed by a system activity (e.g., antivirus scan).
Session Latency and Bandwidth Monitoring |
User experience metrics reported by eG Enterprise include:
- Screen refresh latency for user sessions (also referred to as ICA RTT)
- Client network latency (i.e., latency at the network level from the server farm to the user’s client device – this is referred to as Network RTT sometimes)
- Output and input line speeds
- User’s connection quality (this is a derived metric based on the other KPIs; for details see our earlier blog )
- User’s bandwidth usage (output and input usage)
- Breakdown of bandwidth usage by virtual channel. Details show the bandwidth usage on the audio channel, media channel, drive bandwidth, printer bandwidth and so on.
EDT Performance |
The Citrix virtual apps and desktop architecture uses Adaptive transport as the default protocol. By using adaptive transport, ICA virtual channels automatically respond to changing network conditions. They intelligently switch the underlying protocol between the Citrix protocol called Enlightened Data Transport (EDT) and TCP to deliver the best performance. From a user experience standpoint, it is important to track EDT protocol performance for each user session. Key performance metrics for EDT include round trip latency, bandwidth used, packets lost during transmission and reception, negative acknowledgements received etc. A user experience monitoring tool for Citrix virtual apps and desktops must be able to auto-discover sessions that are using EDT, track the EDT key performance metrics, and alert administrators if there is a significant deviation in any of these metrics.
eG Enterprise is an Observability solution for Modern IT. Monitor digital workspaces,
web applications, SaaS services, cloud and containers from a single pane of glass.


