In this blog post, I follow on from my previous blog on AWS CloudWatch Part 1 of 2 to explore how you can go beyond basic agentless AWS CloudWatch monitoring and get detailed insights into EC2 instances by deploying the CloudWatch agent. I’ll also the key information and planning you need to do this. I’ll also cover how eG Enterprise offers out-of-the-box functionality to avoid complex JSON scripting or tooling to implement monitoring.
Updated October 2023: To add links to useful information on known CloudWatch limitations: Be aware of these CloudWatch Logs limits and quotas | TechTarget
Installing a CloudWatch Agent for Detailed Monitoring of AWS EC2 Instances
If you are deploying Linux or Windows OSs on EC2, you will probably want to deploy the CloudWatch agent on each instance to enable a wider range of in-guest metrics. If you install the agent on an Amazon EC2 instance, the metrics it collects are in addition to the agentless metrics enabled by default for Amazon EC2 instances. For an overview of Agentless vs Agent-based monitoring, please see: Agentless Monitoring vs. Agent Based.
There is a reasonable “Getting Started Guide” for the CloudWatch agent and it is worth reviewing the metrics the agent will enable on Windows Server instances and also upon Linux/MacOS instances. On a server running Microsoft Windows OS, installing the CloudWatch agent enables you to collect the metrics associated with any of the counters in Windows Performance Monitor. The CloudWatch metric names for these counters are created by putting a space between the object name and the counter name. For example, the % Interrupt Time counter of the Processor object is given the metric name “Processor % Interrupt Time” in CloudWatch. For more information about Windows Performance Monitor counters, see the Microsoft Windows Server documentation.

The steps involved in deploying CloudWatch’s agented monitoring have evolved but there is a fair amount of configuration of JSON files or python required even to define which perfmon counters you wish to collect.
Ease of Agent Deployment and Configuring Required Parameters on AWS CloudWatch
There is a degree of complexity involved in configuring an AWS CloudWatch agent. Manipulating the JSON configuration files is cumbersome. You need to:
- Which qualifying metrics to monitor
- Same metrics have different name and syntax across OS (Win, Linux, AIX, etc.)
- Maintain and version control the config.json file
- Handle lengthy Config files – With each increasing metric, the config file tend to become long and prone to mistakes.
For example, to monitor processes on a system:
- Process name – Each process name must be defined
- Metric name – Each metric for the process must be defined
- Metric Collection Interval – Each metric section for metric Collection Interval must be defined if it is to be set other than 60 seconds

Implementing Alerting, Reporting and Dashboards
There are lots of tools within AWS CloudWatch to enable you to configure a monitoring solution but very little ready-to-go functionality. If you are relying on native AWS tools, you may find it helpful to familiarize yourself with the numerous repositories of tutorials that exist to cover common requirements, such as Jackson Connell’s “50 Best AWS CloudWatch Tutorials”.
Out-of-the-box Dashboard
Out-of-the-box there are basic metric dashboards available, but the observability of configured parameters is a somewhat cumbersome task for administrators as they have to toggle between multiple screens and pages to monitor/eyeball the metrics. The basic view of the Default Metrics can be viewed under – EC2 Instances -> Monitoring (see below):

The minimal dashboard functionality mean that many AWS users export the CloudWatch metrics stored in logs to other BI tools, such as ELK or Grafana which offer more advanced visualization and there are charges applicable for these tools.
Configuring Alert Thresholds and Alarms
The majority of administrators, especially with large deployments will want to configure their monitoring systems to proactively notify and alert them of problems. It is unviable for an administrator to physically watch dashboards all day or attempt to manually/visually correlate metrics of concern indicative of an issue. AWS does allow thresholds and alarms to be configured but this is a manual process requiring an admin to decide on the thresholds at which individual metrics should trigger alerts; some problems by their very nature will trigger alert storms.

The conditions based on which alerts can be triggered allow static and “Anomaly detection” thresholds (comparable to “Dynamic” thresholds in Microsoft Azure cloud) to be set. The limitations of these two types of thresholds are well known, and in practice, enterprise-class monitoring solutions, such as eG Enterprise, have integrated functionality to combine the two genres to reduce false positives; as of today, cloud native monitoring within AWS and Azure does not allow this.
Alert and Event Correlation and Root-Cause Analysis
In practice, a single IT issue can trigger numerous thresholds to be crossed generating alerts, where most alarms raised are secondary symptoms of the true fault or bottleneck. The user-implemented thresholding and alerting in cloud native tools as of the time of writing this blog post do not provide the correlation, event filtering, and AIOps root cause diagnosis capabilities available in dedicated enterprise monitoring products.
Licensing/Costs of AWS CloudWatch for Detailed Monitoring of EC2
There are a large number of parameters that affect the costs of CloudWatch and it can become extremely complex even with basic monitoring. Many users underestimate the costs as multiple cost factors must be considered for even single service or metric. Key considerations and factors you need to consider include:
- Configuration and coverage:
- For CPU utilization – Different config.json files must be maintained for same CPU utilization objective cross different OSs.
- Process-wise CPU utilization – Each process must be distinctly added to config.json file.
- If your eventual goal was to be able to routinely monitor the “Top 10 CPU consuming Processes” (a standard feature in monitoring products) – it is essentially impossible to add each process to config.json file. Even if added, the metric counts will run into 1000s.
- Resolution-based licensing:
- Multiple resolutions are available: (<1min, >1min, and 5 mins) – there is a different costing for different time resolutions.
- Data retention:
- Data points with a period of 60 seconds (1 minute) are available for 15 days.
- Data points with a period of 300 seconds (5 minute) are available for 63 days.
- Data points with a period of 3600 seconds (1 hour) are available for 455 days (15 months).
- Dashboard views – CloudWatch implements per dashboard view based costing.
- Log Monitoring:
- Data volume – per GB of data file transferred
- Storage – per GB of data stored on S3
My colleague wrote a recent blog post covering estimating data volumes when deploying Azure Log Analytics and Azure Monitor to monitor WVD/AVD (Windows/Azure Virtual Desktops) and the process of estimating data volumes is similar on AWS. Particularly when monitoring application processes, it is likely that you will need to accumulate some real-world data of your AWS deployment in production to gain realistic estimates of volumes and costs on-going.
AWS has done a respectable job of documenting the process of estimating costs via a number of sample calculations; if your deployment closely matches one of these examples (found at the bottom of this page), they may be very helpful. They give a good overview of many additional types of monitoring that can be added to a deployment and customizations and configurations an administrator is likely needed to make.
Example 1 – EC2 Detailed Monitoring
The number of metrics sent by your EC2 instance as detailed monitoring is dependent on the EC2 instance type – see Instance Metrics documentation for details. This example assumes 7 metrics, which covers the most commonly used instance types.
If your application runs on 10 Amazon EC2 instances 24×7 for a 30-day month, and you enable EC2 Detailed Monitoring on all instances, your charges would be as follows:
Total number of metrics = 7 metrics per instance * 10 instances = 70 metrics
Monthly CloudWatch Metrics Charges @$0.30 per custom metric = 70 * $0.30 = $21
Monthly CloudWatch charges = $21 per month
Once you exceed 10,000 total metrics, then volume pricing tiers will apply – see metrics pricing table for details.
Summary of the Challenges of Using AWS CloudWatch for Detailed Monitoring
If using AWS CloudWatch alone, an administrator should consider and plan how to invest time to address inherent challenges, including:
- Monitoring – Though you can monitor at very granular levels, it will become very complex to manage the config file defining what metrics to collects. Manual maintenance of config files is prone to errors.
- Event correlation – A lot of effort and skills will be required to correlate events, suppress false positive, and help drill down to probable cause.
- Licensing and Costs – This will remain an open-ended question. Budgeting will be difficult as you grow and may lead to unknown expenses and leakages. Additionally, one has to keep in mind the subsequent services like SNS, SSM, EBS, etc. that will be required for effective monitoring and reporting.
- Ease of deployment – AWS Systems Manager may help in a few of the monitoring operations like config release management. However, config files still remain a manual and complicated task. Because of this, and limitations of AWS in consuming a number of metrics, many admins create their own scripts, do the processing needed in their script, and just use AWS as the display tool.
- Observability – Monitoring just by looking at an alarm is not an effective method. Maneuvering across various dependent components and drilling down for root-cause analysis is a key to faster mean time to repair (MTTR).
- Dashboards – They can be extremely handy but will require thoughtful and methodical mechanics in the prior steps of qualifying metrics and building strong correlations. Also, scripting and programming knowledge on LAMBDA, Python, etc. plays a major role in building an effective dashboard for respective teams.
How eG Enterprise Simplifies Detailed Monitoring of AWS EC2 Instances
For many of our customers, especially those choosing hybrid deployments, choosing the native AWS CloudWatch options and an AWS-only interface doesn’t make sense as it is an extra monitoring tool requiring staff to train and maintain and monitor costs. AWS themselves acknowledge that for many of their customers, CloudWatch alone is insufficient or simply too complex for some customers.
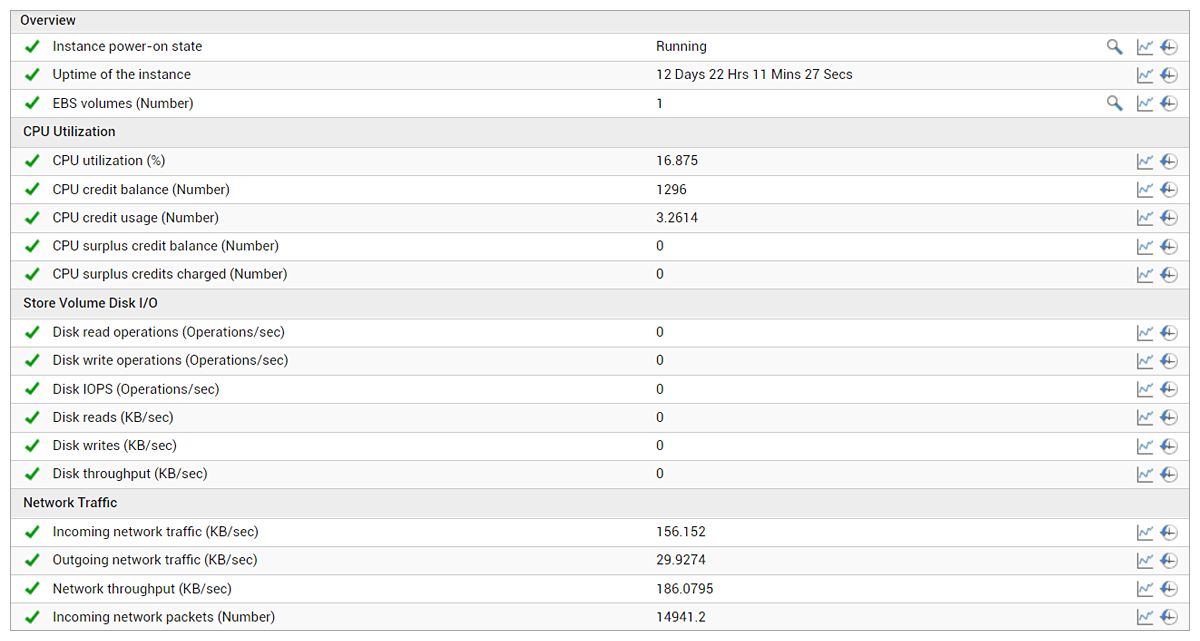
eG Enterprise makes it very simple to monitor your AWS EC2 instances. By integrating with AWS CloudWatch APIs, eG Enterprise provides an “outside view” of the performance of all the EC2 instances. Other than providing credentials to access AWS CloudWatch APIs, there is no configuration necessary. Pre-configured thresholds alert administrators to issues that affect the performance of EC2 instances and applications running on them. Figure 4 below shows some of the key metrics for EC2 instance performance on eG Enterprise.
In-guest metrics can be obtained by simply installing an agent inside the EC2 instance. You need not manually install the agent each time. You can embed the agent in your Amazon Machine Images (AMI), or you can use an orchestration tool like Terraform or Cloud Formation to install the agents as your EC2 instances are provisioned. The default built-in profile of a Windows or Linux system on eG Enterprise ensures that admins don’t have to spend time and effort choosing what metrics to collect. Automatically, the agents collect the pre-defined metrics and you can visualize them in the eG monitoring dashboard (see Figure 5). Everything from CPU and memory utilization, disk IOPS, page file usage, network traffic and errors, TCP retransmissions, status of key services and events in the Windows event logs are monitored by default.

Different visualizations are available. Besides the layer model view, there are other dashboards you can use to visualize the data. If you want, you can create your own custom dashboard as well.
Detailed diagnosis is also automated in eG Enterprise. When a metric changes state to an abnormal state, the agent automatically collects additional details to enable IT admins troubleshoot the problem quickly. For example, in Figure 6 below, you see the detailed diagnosis of a Linux instance that is seeing high CPU utilization. The detailed diagnosis shows the top 10 CPU consuming processes on this instance. Again, administrators do not have to pick and choose what they want to see. eG Enterprise’s detailed diagnosis is pre-tuned to highlight the key details needed to troubleshoot each threshold violation.


Here’s a comparison of the capabilities of eG Enterprise and AWS CloudWatch as it relates to monitoring EC2 instances.
| AWS CloudWatch | eG Enterprise | |
| Ability to collect key performance metrics per instance including CPU credit balance | Yes | Yes, by integration with CloudWatch APIs |
| Simple agent deployment for in-guest metrics | Yes | Yes |
| Ability to collect system KPIs within the guest without much configuration | No | Yes |
| Ability to collect detailed diagnosis data for rapid troubleshooting | No | Yes |
| Cost depends on metric collection frequency and number of metrics collected | Yes | No |
| Extend the same agent to collect application-level performance metrics | No | Yes |
| Ability to collect configuration data about the OS (patches, hot fixes, etc.) and report on changes | No | Yes |
| Ability to automatically monitor key system logs | Only by writing custom scripts | Out of the box |
More details of AWS monitoring with eG Enterprise is available here: eG Enterprise for AWS Monitoring. eG Enterprise is also available as SaaS in multiple AWS regions from AWS marketplace, here: AWS Marketplace: eG Enterprise Express Cloud (amazon.com).
Using eG Enterprise allows AWS users to go beyond CloudWatch to:
eG Enterprise is an Observability solution for Modern IT. Monitor digital workspaces,
web applications, SaaS services, cloud and containers from a single pane of glass.
- Monitor all their AWS components such as EKS, EC2, ELB, RDS, SNS, Amazon Lambda and more, within a single product as a “single pane of glass”, alongside other clouds, such as Google GCP or Microsoft Azure and alongside on-premises physical and virtualized infrastructure, such as Citrix/VMware/Nutanix.
- Use detailed out-of-the-box or customizable reports for forecasting, capacity planning, and management insights based on data that can be retained on whatever timescales suit an organization.
- Deploy metric collection and set up alert/alarm thresholds out-of-the-box with pre-configured industry standard values that can be modified via a GUI, avoiding the need for administrators to code or configure with python or JSON files.
- Update October 2023: Since writing this article I have found a useful article that details some known CloudWatch limitations with which eG Enterprise helps, see: Be aware of these CloudWatch Logs limits and quotas | TechTarget.
Learn More
- AWS Performance Monitoring with eG Enterprise – An overview of key capabilities and features
- Read about Synthetic Monitoring and Testing for Amazon WorkSpaces: Synthetic Monitoring of Amazon Workspaces | eG Innovations
- Read how Israel’s largest supermarket chain leverages an eG Enterprise integration with CloudWatch to manage large and complex auto-scaling deployments: Cloud Issues & Problems – Management Case Study | eG Innovations
- A real-life deep-dive post-mortem case study – debugging slow performance on AWS public cloud burstable instances on EC2, see: AWS EC2 Monitoring Tools | eG Innovations
- More on how eG Enterprise leverages AIOps technologies for event correlation, anomaly detection and root-cause diagnostic analysis: AIOps Tools – 8 Proactive Monitoring Tips
- Cloud Migration Strategy: A Framework for Cloud Adoption and Target Cloud Models – Define your Pathway to Cloud Migration