Strategies for Managing and Monitoring the Digital User Experience
Today’s workforce is rapidly experiencing a cultural revolution. As businesses continue to adopt IT for their core operations and processes, it is more important than ever for IT applications to be reliable and to deliver great performance. Poor application performance results in a loss in business productivity, which in turn has a direct impact on revenues, affects customer satisfaction and tarnishes brand reputation. Therefore, user experience is top of mind for IT executives in today’s application-centric world.
Monitoring just the resource usage of applications and infrastructure elements is no longer enough. IT admins are measured by user experience metrics in today’s digital economy. Hence, the user experience must be central to an IT monitoring strategy, irrespective of the type of applications being used by the business.
User Experience is Much More Than Just Response Time
In today’s digital era, organizations must take a holistic perspective of user experience:
- Clearly, the availability of an organization’s key IT services and their response times to end-users are key measurements of user experience. At the same time, these two metrics alone cannot guarantee a great user experience.
- The degree of proactiveness of an organization also contributes to user experience. The more proactive an organization is, the fewer problems that users notice, and subsequently, the better the user experience.
- The reliability of IT services is another key metric. When a service goes down, how long does it take for the organization to bring it back up to normalcy? The mean time to repair and frequency of such outages also contribute to user experience. The more accurate the diagnosis and the faster the resolution, the better the user experience.
- As the workload of service changes, the IT organization must make sure that the user’s perceived quality of service remains good. Proactive capacity planning plays a key role in this.
 The many dimensions of user experience
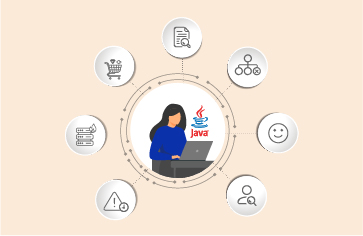
Therefore, organizations need to take a 360o view of user experience and make it a central component of their IT monitoring strategy. This is true irrespective of the type of applications being used by the business – whether digital workspaces (Citrix, VMware Horizon), web applications (Java, .NET, etc.), packaged enterprise apps (SharePoint, SAP , etc.), or SaaS applications (Office 365, Salesforce, etc.).
The latest release of our flagship product, eG Enterprise version 7, introduces several new monitoring capabilities, detailed diagnosis features, new reports, and analytics that help IT organizations deliver the best experience to their business/IT users.
eG Enterprise v7: The Total User Experience Monitoring and Management Solution
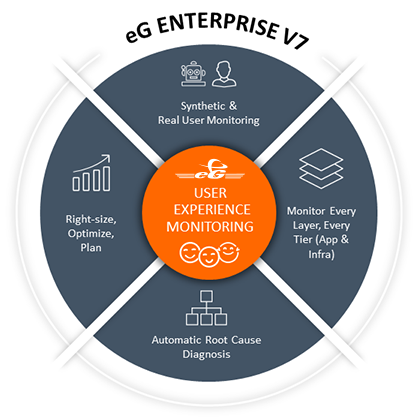
eG Enterprise v7 makes the user experience the centerpiece of your IT monitoring and management strategy.
- Using a combination of synthetic and real user experience monitoring, eG Enterprise enables IT organizations to quantify the quality of service being delivered to users and proactively notifies IT operations teams of impending problems.
- From a central web console, IT teams have insights into the performance of every layer and every tier of the application stack and the underlying infrastructure.
- Correlated topology views and an embedded root-cause diagnosis engine help pinpoint the root cause of user experience issues quickly, thereby helping IT teams reduce mean time to repair and enhance service uptime and performance.
- Lastly, advanced analytics embedded in the solution helps IT teams make the right decisions – from determining how to balance the load in the infrastructure, estimating where to add additional resources, and planning for additional capacity in the future.
The Result: Happy Users, Enhanced Productivity, and Tangible Business ROI.
New Capabilities for All IT Monitoring Use Cases
The enhancements in this release cover all common use cases of application and infrastructure performance monitoring.
|
Digital Workspace Monitoring (Citrix, VMware Horizon)
|
eG Enterprise includes new sensors for the latest additions to the Citrix stack, including Workspace Environment Manager (WEM), App Layering, SD-WAN, etc. Full support for Citrix Cloud is also available. New visualizations like geo maps depicting user locations and session topologies empower helpdesks with exactly what they need to respond quickly to user enquiries. Monitoring support for VMware Horizon 7 architectural changes, including Horizon Cloud Pods, AppVolumes, vSAN, and Linked Clones, have also been added.
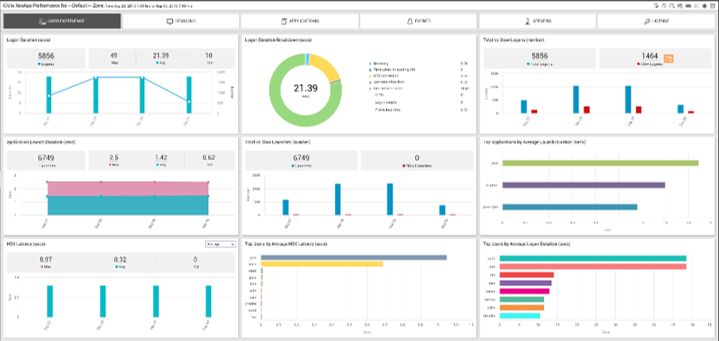 Citrix Virtual Apps Overview Report
|
Web Application Performance Monitoring
|
eG Enterprise v7 gives Ops, DevOps, and developers intelligent and actionable insights into application performance. A web application simulator is a new addition to the synthetic monitoring portfolio of eG Enterprise. Real User Monitoring capabilities have been enhanced to integrate with the latest browser APIs to provide additional client-side latency metrics. Slice-and-dice reporting helps analyze user experience across different dimensions. Additional insights into backend processing across big data platforms, message queues, and search technologies help troubleshoot server-side slowness. Transaction tracing for Microsoft Azure web apps, PHP, and Node.js applications are now supported.
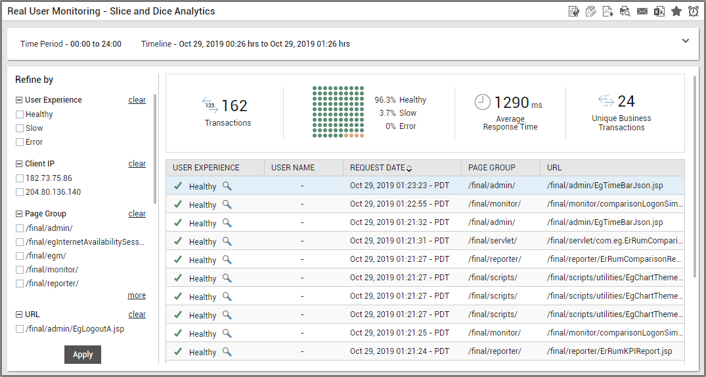 Slice and dice report for Real User Monitoring
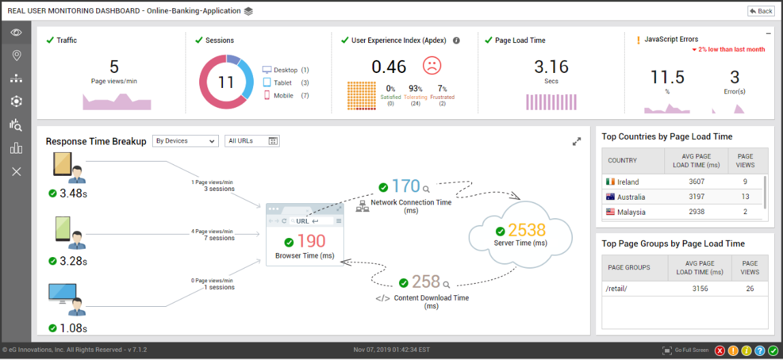 Web Application-level Page Load Time Breakdown in RUM
|
Enhanced Monitoring for Enterprise Applications
|
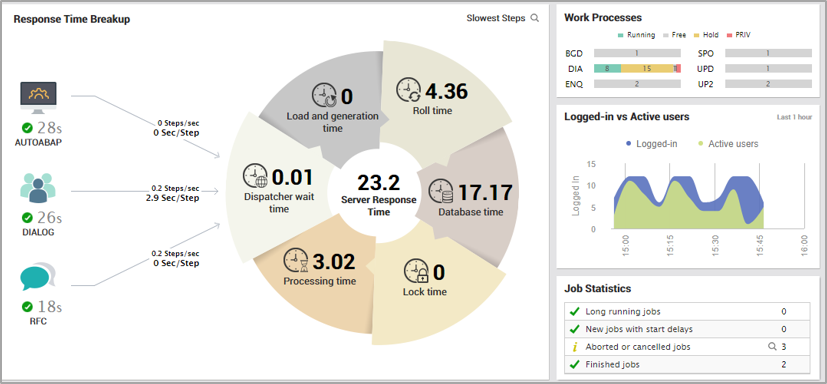
New monitoring capabilities and custom dashboards have been introduced for enterprise applications like SAP and SaaS services, including Microsoft Office 365 and Salesforce.
|
Expanded Coverage for End-to-End Unified Monitoring
|
Full support is available for monitoring Docker and Kubernetes, Hadoop, Cassandra, Redis, MuleSoft, Atlassian Confluence, Apache Active MQ, Elasticsearch, Microsoft SQL reporting services, and many other application and infrastructure platforms. Coverage extended for modern applications, big data environments, message queueing technologies, additional storage, and network devices.
To provide more extensive coverage of IT infrastructures, eG Enterprise v7 has added monitoring support for an array of new components.
| Network Devices | Databases | Other IT Platforms |
|
|
|
| Storage Systems | ||
|
 |
Deployment, Configuration, Security, and UI Enhancements in eG Enterprise v7:
|
- Increased security: two-factor authentication (2FA), single sign-on (SSO), OWASP vulnerability protection
- Full-fledged SaaS deployment: fully self-provisioned & truly multi-tenant
- One-click dashboard templates make it easy to create new dashboards
- New Report Builder allows users to easily create custom reports
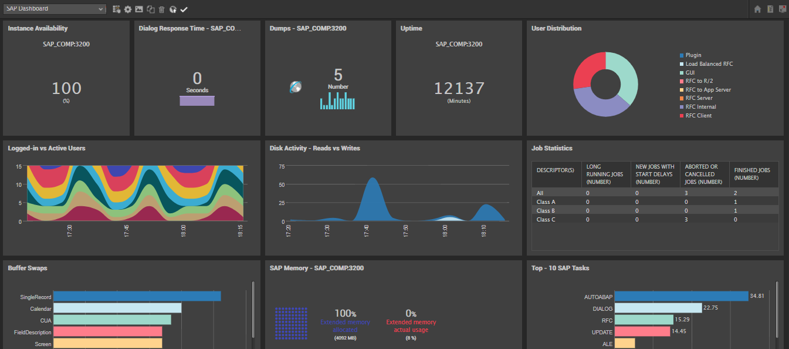 One-Click Dashboard in eG Enterprise v7
eG Enterprise v7 enables organizations to take a 360o view of user experience. The many enhancements in this release help organizations quickly troubleshoot complex application and IT infrastructure problems without affecting user productivity and customer satisfaction. For the full list of new enhancements, you can visit: https://www.eginnovations.com/it-monitoring/whats-new.
Based on customer feedback and market analysis, eG Innovations will continue to build new monitoring, diagnosis, and reporting functionality to address the performance management the needs of the modern technology landscape. We are committed to making eG Enterprise even more robust, intelligent, automated, scalable, and easy to use in future product releases.
eG Enterprise is an Observability solution for Modern IT. Monitor digital workspaces,
web applications, SaaS services, cloud and containers from a single pane of glass.


