How to Detect Application Performance Issues at The Code Level?
 Forty-three percent of application performance problems occur because of an issue in the application code, according to a DZone study. Code-level issues include bugs in the code constructs, such as long waits, poor iterations, inefficient code algorithms, unhandled exceptions, bad choice of data structures, etc. Developers and application owners need code-level insight using distributed application transaction tracing, so they can pinpoint issues in the code and fix them before users notice.
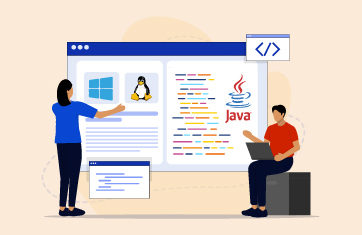
eG Enterprise is an application performance monitoring (APM) and troubleshooting tool that helps you diagnose code-level issues in web applications – powered by Java and .NET. A key component of eG Enterprise is it’s distributed transaction tracing capability.
What is Distributed Application Transaction Tracing?
Distributed tracing is a method of tracking application requests as they move through the application delivery chain – from frontend applications to middleware to backend services and database servers. Developers can use distributed transaction tracing to troubleshoot requests that experience high latency or errors. With distributed transaction tracing, without making any changes to your application code, you can see slow methods, slow HTTP calls, slow database queries, exceptions in your code, etc. Typically, a tag and follow approach is used for application transaction tracing. Requests are identified uniquely, processing times are noted at each tier of the delivery chain and this information is then used to present simple views to developers, clearly highlighting where the application bottlenecks are.
Distributed Application Transaction Tracing with eG Enterprise Identifies Code Issues
Distributed transaction tracing with eG Enterprise helps application managers track and follow every user transaction from any device (web and mobile). Using byte-code instrumentation, eG Enterprise auto-discovers the URLs being accessed by users, tracks the time taken for the server to respond, and alerts when slowness is detected. A transaction flow map helps to visualize the different stages of transaction processing.
Using distributed transaction tracing, you can easily pinpoint the exact line of application code that is taking high processing time and causing slowness. Additionally, you can also detect if there are any slow queries to the database that are causing slowness or any slow third-party calls. This capability is currently available for Java and .NET web applications. Transaction tracing for Node.js and PHP are also supported. Watch the below videos to get a quick overview of eG Enterprise APM and see distributed transaction tracing in action.
Distributed Transaction Tracing for Java Applications
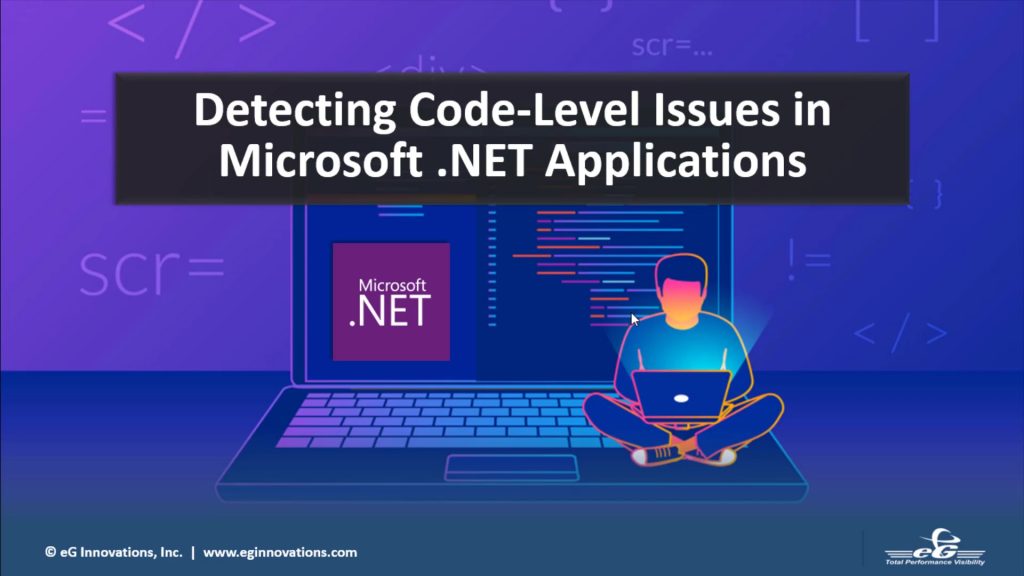
Distributed Transaction Tracing for Microsoft .NET Applications
eG Enterprise goes beyond transaction tracing and helps diagnose issues in the underlying application infrastructure – applications servers, databases, message queues, virtualization and cloud platforms, and so on. If you want to know more about how eG Enterprise performs distributed transaction tracing, watch the webinar below.
eG Enterprise is an Observability solution for Modern IT. Monitor digital workspaces,
web applications, SaaS services, cloud and containers from a single pane of glass.


