How to Monitor Your Payment Gateways for Top Performance
Introduction
 Payment gateway outages and slowness have a disruptive effect on e-commerce application performance and ultimately, your business. When customers cannot complete a transaction, it leaves them frustrated and anxious. Even if it is not an outright outage, customers are wary of a flaky payment experience. They are often reluctant to retry the transaction for fear of being charged twice. This results in abandoned purchases and lost revenue.
During peak holiday periods, customers who are unable to complete their transactions may flood your contact center. Some might vent their anger on social media. This can severely impact your bottom line and damage both revenue and reputation. It is, therefore, important for you to track how well your electronic business is working and especially if the payment gateway service is available and responding on time.
In this article, we’ll cover:
- What are payment gateways and what makes troubleshooting them challenging?
- Key questions that site reliability engineers (SREs) should ask in the payment gateway troubleshooting process
- What dashboards do SRE teams need to monitor the health of payment gateways?
- How to use full-stack monitoring to ensure top-notch e-commerce customer experience
What is a Payment Gateway?
A payment gateway is a third-party software service that securely sends payment information (such as credit card details) typically from the checkout page of a website to the credit card payment networks for processing and returns the response from the payment networks back to the website.
Payment gateways come with an array of benefits:
- They support different payment modes such as debit cards, online banking accounts, or online wallets. They also support multi-country, multi-language, multi-currency, and multi-time-zone processing.
- They make it easy for you to be PCI-DSS compliant. The customer’s bank or card details are stored in the payment gateway’s infrastructure – not yours.
- They provide fraud screening tools to reduce the risk of fraudulent transactions.
Examples of prominent payment gateways include PayPal, Stripe, and Square.
What Makes Troubleshooting Payment Gateways Challenging?
Payment gateways are complex systems. A single transaction in payment processing systems travels through multiple sub-systems. Each transaction involves:
- Multiple parties – your own website (i.e., merchant website), acquiring bank (also known as the merchant acquirer), card networks, and issuing bank.
- Multiple processing stages – fraud checks, 3D Secure confirmation, approve, or decline decisions.

All these steps must finish in a matter of seconds with each step taking microseconds. A single glitch in any of these entities or stages can cause an online transaction to fail.
Most Payment Gateway Issues are Noticed After the Event
 A customer may report the issue with the payment experience, or a business stakeholder may notice a decrease in sales volumes. Not only is this embarrassing but also too late to mitigate any damage to revenue. Some teams may resort to manually searching downtime alerting websites, but this is a hit-or-miss and is not an optimal strategy.
It is important for SRE teams to be proactive and detect issues before they impact customers.


Modern transactional online retail systems often span hybrid infrastructure including some on-premises application components and several multi-cloud services designed for failover and auto-scaling. It is common to find e-commerce systems utilizing application servers and microservices hosted within frameworks, such as Kubernetes, using containers, such as Docker, hosted on multiple clouds, such as Microsoft Azure, Google GCP (Google Cloud Platform), and Amazon AWS (Amazon Web Service). Within the context of these complex and dynamically scaling systems, it is critical to differentiate third-party service issues such as those with payment gateways from issues within your own applications or those associated with a cloud supplier.
Key Questions that SREs Should Ask in the Payment Gateway Troubleshooting Process
Site reliability engineering (SRE) teams must have visibility on error rates and response times across all payment gateways. They need to rapidly identify slowness or failure with any individual payment gateway and inform their customers proactively. It is also key for SRE teams to inform management of the business impacts including the cost of lost sales and which users were impacted so follow-up mitigation steps can be actioned.
The following is a high-level checklist of questions that might be helpful for SRE teams:

- Service-level quality questions:
- Availability: Is the payment gateway up and running?
- Functionality: Is the checkout and payments functionality working right? Are there any errors?
- Speed: Is the payment gateway responding fast enough?
- Can we get proactive, real-time alert notifications when a payment gateway is down?
- Can we triage payment errors or slowdowns by their impact on revenue?
- Based on the payment gateway health, can we enable or disable different payment gateways?
- Can we pinpoint payment gateway issues to geographically local issues?
- Can we identify impacted users for retargeting purposes (give them offers/coupons to mitigate their frustration)?
- Can we assess the effects of IT changes in pre-production and test systems before they are released to production systems where real users may be affected?
5 Key Insights You Need for Monitoring Payment Gateways
| Insight #1 |
Visualize microservices and payment gateway dependencies in a service map topology |
![]() The Challenge: Usually your payment gateway is outsourced – it could be a third-party payments-as-a-service – i.e, a SaaS (Software as a Service) service and you will have an in-house payments microservice layer which acts as a client to multiple 3rd parties. It is essential to understand the architecture of your service that is potentially spread over multiple clouds.
The Challenge: Usually your payment gateway is outsourced – it could be a third-party payments-as-a-service – i.e, a SaaS (Software as a Service) service and you will have an in-house payments microservice layer which acts as a client to multiple 3rd parties. It is essential to understand the architecture of your service that is potentially spread over multiple clouds.
You need the ability to visually see transactions traversing the complex configuration, so various operations teams can research and troubleshoot from one common console.
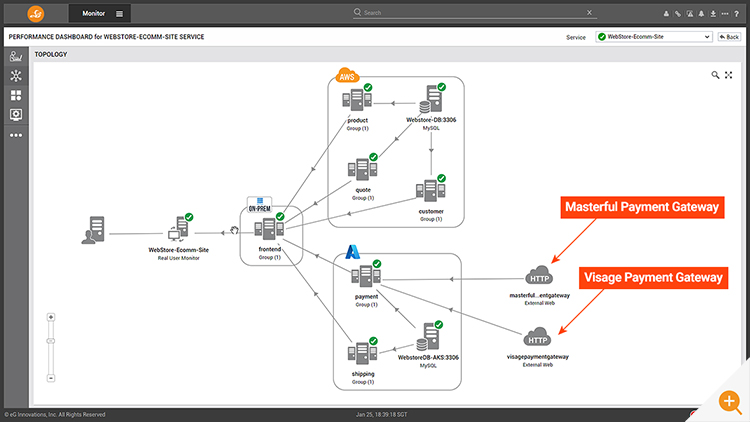
![]() The Solution: Application Performance Monitoring (APM) solutions are capable of auto-discovering the application topology including the inter-dependencies of applications and the infrastructures they are hosted on. Since modern applications make use of cloud-native auto-scaling capabilities, auto-discovery is an essential functionality to deal with dynamic infrastructure where containers may be spun up or down based on demand. In the example in Figure 1, the online store shop front and inventory is hosted on AWS cloud but the payment and checkout pages are on Azure cloud. The payment and checkout pages rely on third-party payment gateway services – in this case, Masterful and Visage.
The Solution: Application Performance Monitoring (APM) solutions are capable of auto-discovering the application topology including the inter-dependencies of applications and the infrastructures they are hosted on. Since modern applications make use of cloud-native auto-scaling capabilities, auto-discovery is an essential functionality to deal with dynamic infrastructure where containers may be spun up or down based on demand. In the example in Figure 1, the online store shop front and inventory is hosted on AWS cloud but the payment and checkout pages are on Azure cloud. The payment and checkout pages rely on third-party payment gateway services – in this case, Masterful and Visage.
With a holistic view of the entire application delivery chain, the service operations team is proactively alerted to customer transaction bottlenecks before they become failures.
| Insight #2 |
See in-context alerts to pinpoint which specific payment gateway is unhealthy to keep third party vendors accountable |
![]() The Challenge: Applications may be configured to use multiple payment gateways. Some payment gateways may be working well, but others may not be healthy. Monitoring products should identify those gateways with issues and provide sufficient information to identify common factors such as geographic region, browser type and version, payment gateway provider/vendor, etc. Furthermore, they need to provide additional details as to whether payments are failing because of the internal network, applications, or other third-party service providers?
The Challenge: Applications may be configured to use multiple payment gateways. Some payment gateways may be working well, but others may not be healthy. Monitoring products should identify those gateways with issues and provide sufficient information to identify common factors such as geographic region, browser type and version, payment gateway provider/vendor, etc. Furthermore, they need to provide additional details as to whether payments are failing because of the internal network, applications, or other third-party service providers?
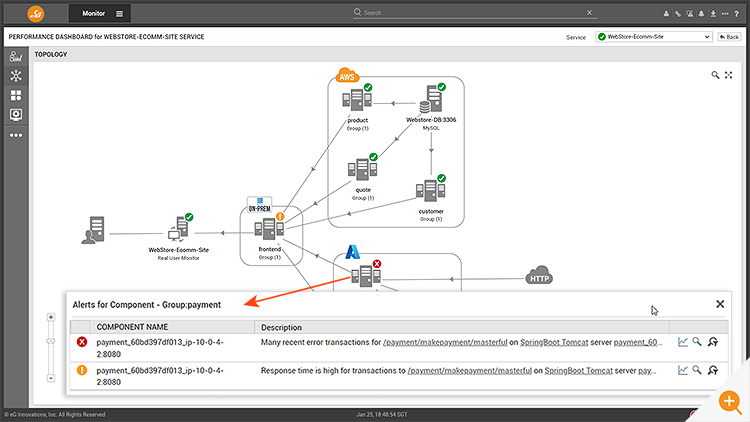
![]() The Solution: APM solutions monitor every layer and every tier supporting the application. Help desk operators get an instant color-coded view that pinpoints when payment systems fail or have problems (see Figure 2), raising alerts into the alert window to and triggering notifications to ITSM tools such as ServiceNOW and PagerDuty. Alerts can also be sent as email/SMS notifications. AIOps (Artificial Intelligence for Operations) capabilities embedded in these tools enable root-cause analysis and identification of the cause of the issue. AIOps technologies leverage machine learning to determine norm of each payment system at different times of day, days of month, etc. and flag anomalous behavior.
The Solution: APM solutions monitor every layer and every tier supporting the application. Help desk operators get an instant color-coded view that pinpoints when payment systems fail or have problems (see Figure 2), raising alerts into the alert window to and triggering notifications to ITSM tools such as ServiceNOW and PagerDuty. Alerts can also be sent as email/SMS notifications. AIOps (Artificial Intelligence for Operations) capabilities embedded in these tools enable root-cause analysis and identification of the cause of the issue. AIOps technologies leverage machine learning to determine norm of each payment system at different times of day, days of month, etc. and flag anomalous behavior.
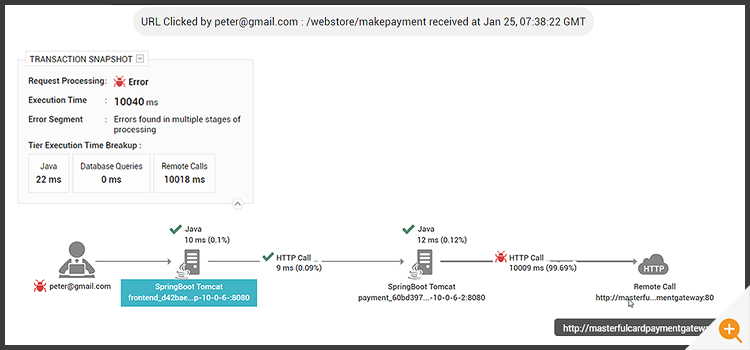
Alerts allow drilldown to get more details on failures and performance issues such as slow transactions (see Figure 3).
This capability allows SRE teams to obtain a fast resolution from a third-party payment gateway vendor. SRE teams can provide payment gateway vendors with irrefutable evidence of the issue and its severity and demand quick resolution.
In Figure 4, you can see how an APM solution (eG Enterprise in this example), enables you to collate all the relevant data to prove that an issue occurred and details including:
- What was the payment gateway error?
- When did the error occur? How often has it occurred over the last month?
- What was the extent of potential damage to revenue?
| Insight #3 |
Identify end users (to the extent privacy rules allow you) for proactive follow-up and personalized support |
![]() The Challenge: When users abandon their purchase due to a payment error, you need information that can be used for personalized support and assistance. Customer service teams might want to follow up with the user to help them complete the failed purchase and offer any incentives (e.g., vouchers or credits) to remedy the situation.
The Challenge: When users abandon their purchase due to a payment error, you need information that can be used for personalized support and assistance. Customer service teams might want to follow up with the user to help them complete the failed purchase and offer any incentives (e.g., vouchers or credits) to remedy the situation.
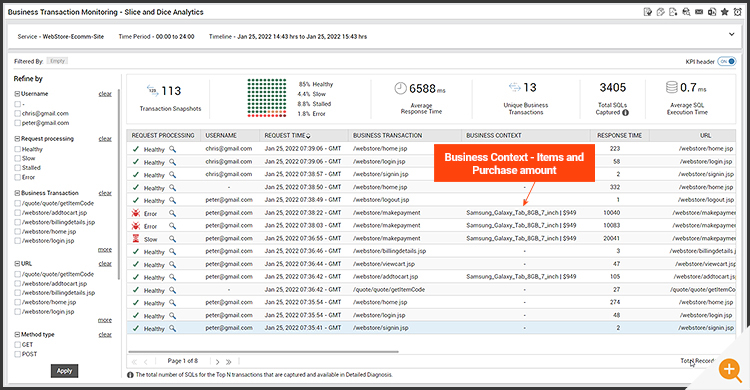
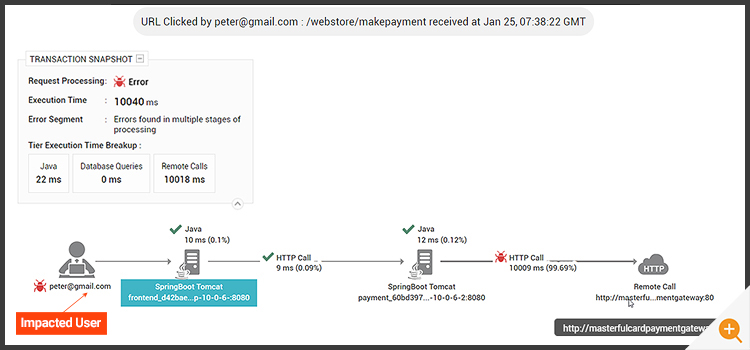
![]() The Solution: APM tools like eG Enterprise, automatically extract the username to uniquely identify your users across different browsers and devices. The name of the user who initiated a request can be obtained from different sources – e.g., a HTML DOM element, a meta tag, a JavaScript variable, a cookie attribute or a server-side method/function.
The Solution: APM tools like eG Enterprise, automatically extract the username to uniquely identify your users across different browsers and devices. The name of the user who initiated a request can be obtained from different sources – e.g., a HTML DOM element, a meta tag, a JavaScript variable, a cookie attribute or a server-side method/function.
You can also expand this facility to pull a list of users for batch processing (example: bulk email) by customer service teams. Your customer service teams will thank you for providing them with the ability to pinpoint why and when the customer was impacted and proactively resolve their issue.
| Insight #4 |
Track Payment Gateway API responses and latencies in real-time |
![]() The Challenge: Even when issues are identified with a third-party service such as a payment gateway, a business may be reliant on that third-party to resolve an issue. At the same time, additional insights can allow businesses to take control of their online presence and mitigate the damage to their business and brand. For example, if a specific gateway in a limited geography is at fault, the application can be reconfigured so that customers are directed to another working payment gateway.
The Challenge: Even when issues are identified with a third-party service such as a payment gateway, a business may be reliant on that third-party to resolve an issue. At the same time, additional insights can allow businesses to take control of their online presence and mitigate the damage to their business and brand. For example, if a specific gateway in a limited geography is at fault, the application can be reconfigured so that customers are directed to another working payment gateway.
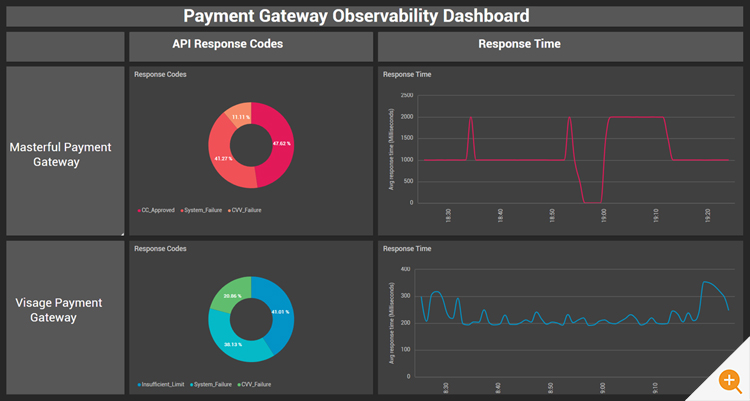
![]() The Solution: With full API (Application Programming Interface) integration, APM tools like eG Enterprise can identify payment failures associated with problems such as users input the wrong CVV code or exceeding their authorized credit limit.
The Solution: With full API (Application Programming Interface) integration, APM tools like eG Enterprise can identify payment failures associated with problems such as users input the wrong CVV code or exceeding their authorized credit limit.
Figure 6 illustrates a dashboard in which the charts on the left are based on showing response codes from payment gateway APIs while the panels to the right show speed of processing (i.e., response time).
| Insight #5 |
Track Payment Gateway errors in real-time |
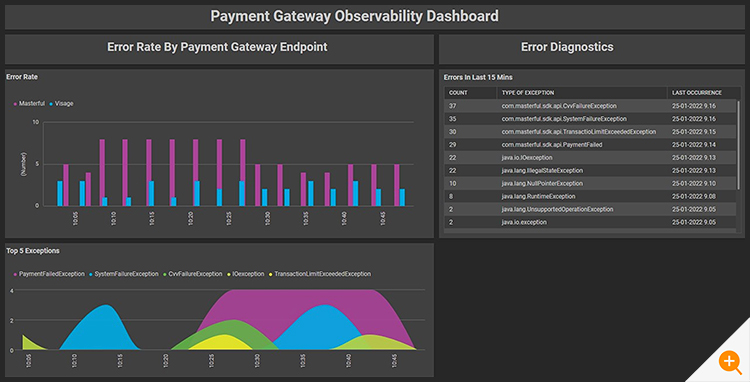
![]() The Challenge: We have so far looked at performance and latency dimensions of payment gateways above. Another important dimension is error tracking. Errors are a fact of life in software engineering, but they can create unhappy customers. SRE teams need a clear visibility into the most important errors based on how often they occur and how they impact users. This allows you to also give confidence to your engineering teams to deploy faster and debug problems quickly.
The Challenge: We have so far looked at performance and latency dimensions of payment gateways above. Another important dimension is error tracking. Errors are a fact of life in software engineering, but they can create unhappy customers. SRE teams need a clear visibility into the most important errors based on how often they occur and how they impact users. This allows you to also give confidence to your engineering teams to deploy faster and debug problems quickly.
![]() The Solution: APM tools provide insight into:
The Solution: APM tools provide insight into:
- Error rates by payment gateway endpoint
- Top exceptions split by original URL
- Detailed error diagnostics and line-of-code to fix the issue
Full-Stack Monitoring is Key
Third-party service failures such as payment gateway issues are just one specific problem that can impact user experience and customer conversion rates for your eCommerce sites. Most of our retail and eCommerce customers invest a lot of time and effort leverage the insights and technologies of eG Enterprise to optimize their sites since even a 1 second delay in website loading time can result in a 7% reduction in conversion and up to 16% decrease in customer satisfaction but that is one for another blog.
SRE teams need wide and deep insight into customer experience across the website. Full stack monitoring solutions provide you with an array of capabilities such as:
- End user experience insight:
- RUM (Real User Monitoring) – monitoring of the user journey or every user, anytime, from anywhere, on any browser, from any device. Using an agentless approach, eG Enterprise passively and continuously monitors end-user experience in real-time. You also get the ability to visualize end-to-end each user journey as they travel from the browser to the database across machines spanning on-premises and cloud.
- Synthetic performance monitoring works by actively simulating the application(s) being monitored and measuring the availability and responsiveness of the application. By periodically running synthetic monitors, IT managers can be sure to receive alerts when an application becomes unavailable, or its response slows down. Unlike RUM, synthetic monitoring allows you to monitor without the presence of actual users. Also, since the monitoring is done from a specific location(s) and using the same clients, synthetic monitoring provides a consistent measure of performance. Therefore, any changes in performance can be easily analyzed. This is also useful for pre-production testing to assess and verify the effects of system configuration changes and ensure IT changes will not impact real customers.
- Code-level diagnostics:
- APM (Application Performance Monitoring) code-level diagnostics and traces correlated with metrics, logs and events from application code to bare metal – across cloud, virtualized, containerized, physical, and hybrid IT infrastructures to gain deep performance visibility and proactive anomaly detection and alerting. APM provides you with the ability to track each transaction across all layers and tiers and the ability to navigate from an individual user click to code-level or database statement.
- Infrastructure monitoring:
- Monitor your hybrid and cloud native architectures across on-premises and cloud.
- Collect key metrics that highlight bottlenecks – e.g., CPU credits in the cloud, CPU ready time in a VMware infrastructure, disk queue lengths, etc.
- Auto-baseline infrastructure usage and performance and use this to identify problems proactively.
- Correlate infrastructure and application performance and pinpoint where the performance bottleneck lies.
- Enhance observability by augmenting metrics and transaction traces with insights from log monitoring. Analyze application and OS logs to identify any error patterns.
Conclusion
Customers demand fast, simple, and secure payments whether buying online, in-store, or via mobile devices. It is incumbent on SRE teams to ensure a smooth checkout and payment experience.
In this article, we started by looking at what a payment gateway is and what makes troubleshooting them complicated. We also outlined a list of key questions that SREs should ask in the payment gateway troubleshooting process. We walked through visual dashboards that can aid the troubleshooting process. Finally, we outlined how full-stack monitoring capabilities can help ensure top notch payment and customer experience.
eG Enterprise is an Observability solution for Modern IT. Monitor digital workspaces,
web applications, SaaS services, cloud and containers from a single pane of glass.
Learn More
- An overview of critical APM (Application Performance Monitoring) factors that eCommerce and retail apps should consider – Application Performance Monitoring – What is APM | eG Innovations
- Learn how eG Enterprise allows full help and service desk integration to track and analyze eCommerce issues within tools such as ServiceNOW, AutoTask, JIRA and more: Service and Help Desk Automation Strategies | eG Innovations
- Shufersal is Israel’s largest supermarket chain, with more than 300 stores and revenues of over $3 billion USD$. Tightly integrated with AWS CloudWatch, eG Enterprise enables Shufersal to track the digital experience of applications hosted in the cloud, analyze application workloads and transactions, and correlate them with the performance of the IT infrastructure – all from a single pane of glass. Cloud Issues & Problems – Management Case Study | eG Innovations
- Learn more about leveraging the AIOps features within eG Enterprise: AIOps Tools – 8 Proactive Monitoring Tips | eG Innovations
- Watch a demo: Demo: Converged Application & Infrastructure Performance Monitoring
eG Enterprise is an Observability solution for Modern IT. Monitor digital workspaces,
web applications, SaaS services, cloud and containers from a single pane of glass.



 Arun is Head of Products, Container & Cloud Performance Monitoring at eG Innovations. Over a 20+ year career, Arun has worked in roles including development, architecture and ops across multiple verticals such as banking, e-commerce and telco. An early adopter of APM products since the mid 2000s, his focus has predominantly been on performance tuning and monitoring of large-scale distributed applications.
