Last week, we hosted a great webinar with our partner Conversant Group. John Worthington (Director – Customer Success, eG Innovations) and Richard Faulkner (Enterprise Solutions Architect, Conversant Group) presented on the topic: “End-to-End Citrix monitoring with a single pane of glass“.
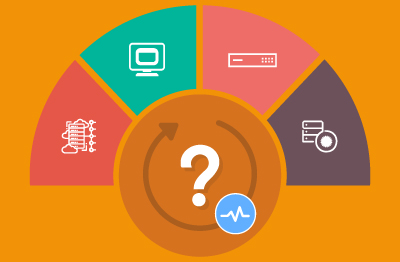
The webinar included a live demonstration of how our eG Enterprise solution provides an end-to-end view of the Citrix deployment including the Citrix ADCs, Delivery Controllers, License servers, Virtual App servers, Virtual Desktops, and other Citrix tiers including WEM, AppLayering, and others. Citrix Cloud is also supported.
A colleague and I were answering questions during the live webinar and we received a lot of questions. One of my favorite aspects of participating in these webinars is the high quality and breadth of questions that we receive from our attendees. We had the opportunity to answer several questions during the session but there are always many more that we simply can’t get to, and of course there are always a few that we wish we had answered better. So, I’ve compiled, enhanced, and answered the full set of questions below.
Questions & Answers on End-to-End Citrix Monitoring
- 1 Could you please explain the licensing cost for this end-to-end Citrix monitoring product [eG Enterprise]?
- 2 How is the eG Logon Simulator licensed?
- 3 Is eG Enterprise an on-premises or a cloud solution for end-to-end Citrix monitoring?
- 4 Have you had customers utilize synthetic monitoring to validate more than just Citrix session availability and performance? For example, to simulate a user logging into a Citrix session and then interacting with a web app or a SaaS product.
- 5 Can eG Enterprise be configured for multi-tenancy? And can customers monitor and manage their own infrastructure themselves?
- 6 Can this monitoring tool be used as an administrative tool, for example, with built-in commands or by adding customized scripts?
- 7 You didn’t mention monitoring of physical desktops… Can you monitor those endpoints as well?
- 8 Is there an integration module with NetScaler?
- 9 Is there any documentation for the plug-ins for the ADCs?
- 10 Is eG Enterprise compatible with Nutanix AHV and its metrics and can it gather the same data as the VMware host used in the demo?
- 11 Can we use Nutanix for running the Citrix environment?
- 12 Do you have any in-depth analysis for Profile Load time for a user session?
- 13 Is there a way to get a report that shows which paths or files within UPM profiles are using the most space so the admin can investigate if it should be excluded from the profiles?
- 14 How fast does the monitoring agent refresh the monitoring data?
- 15 Another question, is there any reporting function for this product that can have up to 1 year performance data in the database? If there is, is that function included in the base price, or does it have to be a separate module to purchase?
- 16 What is [eG’s] Standard SLA for technical help required for customer?
- 17 What are the options for alerting to teams? (e.g., email, ServiceNow, SMS) And are there thresholds to ensure false alarms are mitigated?
- 18 What version of eG was used for the demo in this webinar?
- 19 Does this work with or is it a replacement for existing Citrix Performance Analytics?
- 20 I am looking to deploy several agents to monitor Citrix Remote PC. Do I have to install agents manually one by one?
- 21 How could your single pane solution help end users complaining of less than great experiences? How much information can you share? Thanks!
- 22 Can this tool monitor end-user ISP issues, for example if the user is in Asia or Africa and if the bottleneck is at an ISP, can this tool pinpoint that?
- 23 Is there a report or dashboard that can be made available for desktop users to see what might be impacting their experience?
Could you please explain the licensing cost for this end-to-end Citrix monitoring product [eG Enterprise]?
https://www.eginnovations.com/documentation/eG-Licensing-Policy/Licensing-FAQ.htm covers most of the FAQs about our licensing policy. eG Enterprise for Citrix VAD is licensed by server host or by named or concurrent user (that’s real and active users, not the list in your Active Directory). The concurrent user model works well for organizations with shift patterns, e.g. call centers. While the host-based licensing model works well if you are getting a high density of users per host/virtual app server instance, one of the user-based licensing models is better if the user density you are getting in your Citrix infrastructure is low.
We’ve published a transparent page “An Overview of Pricing and Licensing Options for eG Enterprise“ and our licensing FAQs should answer further questions.
You can contact us to get exact pricing for your Citrix infrastructure, but in general, our amortized monitoring cost for a single-pane-of-glass Citrix monitoring solution is less than the cost of a cup of coffee per user per month.

How is the eG Logon Simulator licensed?
Licensing is based on number of simulation locations, not on the number of Citrix logons simulated. The free Logon Simulator gives you free monitoring for one location. You can get the FREE Logon Simulator, here: Citrix Logon Simulator – Free Logon Simulator | eG Innovations
Is eG Enterprise an on-premises or a cloud solution for end-to-end Citrix monitoring?
We can deploy eG Enterprise either way: on-premises or as a SaaS service. More details of our SaaS service for end-to-end Citrix monitoring are available here.
Have you had customers utilize synthetic monitoring to validate more than just Citrix session availability and performance? For example, to simulate a user logging into a Citrix session and then interacting with a web app or a SaaS product.
Yes, there are multiple synthetic monitors embedded in eG Enterprise. If you want to monitor any third-party SaaS app from a desktop browser, you can use our Web Application Simulator. If you want to simulate a Citrix session that starts with a login into Citrix, launching of a browser, and then accessing a web application or SaaS service from within Citrix, you can use our Full Session simulation tool.
The full session simulation tool goes beyond logon and allows you to record transactions and actions within your Citrix session – so you can test whether your SaaS , such as Salesforce are working properly in your Citrix session and how responsive they’re. The robotic user can open a customer record, update it, etc., to test the entire service delivery chain. And yes, *lots* of customers are using this functionality.
Can eG Enterprise be configured for multi-tenancy? And can customers monitor and manage their own infrastructure themselves?
Yes! The eG Enterprise solution has logical containers that allow for multi-tenancy. Lots of MSPs (Managed Service Providers) offer portals from where their customers can login and view the health of their key applications and infrastructure themselves. There’s some more info on this here: https://www.eginnovations.com/company/msp-partners.
Can this end-to-end Citrix monitoring tool be used as an administrative tool, for example, with built-in commands or by adding customized scripts?
There are three ways in which scripts can be used in eG Enterprise:
- To add new monitoring capabilities into the system (e.g., to collect a metric or monitor an application that is not supported out of the box)
- To remote control a system, a user session, or application from the web-based console itself (e.g., to take a screenshot of a session, to reboot a system, log off a user, etc.). While a number of built-in commands are supported, you can add custom scripts/commands here as well.
- To take automatic corrective actions without any human intervention. For example, if a service has stopped, you can have it automatically restarted using eG Enterprise’s auto-correct capability
For additional information, you might like to read Barry Schiffer’s blog on this functionality https://www.eginnovations.com/blog/automation-integration-monitoring/ or the documentation on Remote Control Actions https://www.eginnovations.com/documentation/Monitoring-Using-eG-Enterprise-Suite/Control-Actions.htm.
You didn’t mention monitoring of physical desktops… Can you monitor those endpoints as well?
Yes – we can. eG Enterprise has a lightweight endpoint agent specifically for this purpose. However, many of our clients would rather not have to deploy agents and because we can use the Citrix API to help isolate things like slow home networks without the need for an agent, many choose to do that… In fact, the recent survey we did suggested many customers may want to troubleshoot endpoints on-demand when issues occur… And indeed, many of our customers take this approach.
Is there an integration module with NetScaler?
Yes, you can find details of our NetScaler (now Citrix ADC) integration, here: Citrix NetScaler Performance Monitoring from eG Innovations. There’s a full list of all the Citrix and non-Citrix components we monitor available here: IT Monitoring Technologies & Supported Platforms | eG Innovations (use the tabs such as “Virtualization” to explore in detail).
We also support alternative popular load balancers, such as F5 and non-VDI infrastructure that often sits behind a load balancer such as Microsoft IIS and SharePoint.
Is there any documentation for the plug-ins for the ADCs?
The documentation is here https://www.eginnovations.com/documentation/Citrix-Netscaler-VPX-MPX/How-to-Monitor-Citrix-NetScaler-VPX-or-MPX-Using-eG-Enterprise.htm (navigate via the left-hand index) and there is more information here: https://www.eginnovations.com/citrix-monitoring/netscaler-monitoring (yes, we need to update the name 
Is eG Enterprise compatible with Nutanix AHV and its metrics and can it gather the same data as that for a VMware host?
Yes, eG Enterprise supports monitoring of Nutanix AHV and we are a Nutanix technology partner. Nutanix exposes very similar information via their APIs as VMware does, so the data you see within eG Enterprise for VMware is very comparable to AHV monitoring. The full details of the metrics are available in our documentation: Introduction to Nutanix (eginnovations.com)
There is a nice blog on our overall Nutanix integration: Nutanix Performance Tools for Issues Resolution | eG Innovations as well as a solution brief: Nutanix and eG Innovations: Ensuring high performance and IT efficiency of hyper-converged infrastructures.
Can we use Nutanix for running the Citrix environment?
Yes, you can read about the joint Citrix-Nutanix partnership on either the Citrix (here) or Nutanix (here) sites. We (eG Innovations) are both a Citrix and Nutanix technology partner, certified for use with both technologies. As such we are a popular choice for customers, who choose mixed vendor stacks to monitor both technologies within a unified interface and to avoid staff having to learn and manage multiple consoles.
Do you have any in-depth analysis for Profile Load time for a user session?
Yes, eG Enterprise provides in depth information about a user’s profile load time. You can also get details of a user’s profile size, number of files in the user’s profile, and any large files in the profile, so you can determine if profile loading is slow because of the contents of the user’s profile. There’s an overview of the detail we capture to analyze Citrix Logon performance, here Monitoring and Troubleshooting Citrix Logon Issues (eginnovations.com). Please also see our documentation for additional reference. https://www.eginnovations.com/documentation/Citrix-XenApp-Servers/User-Profile-Management-Test.htm?Highlight=profile%20management.
It is worth noting that eG Enterprise captures this full breakdown for every single real and synthetic logon and the complete details are stored in our historical database. This means that the data can be analyzed retrospectively within the context of the whole infrastructure and real failures captured. We do not rely on the target system being up at the time when the data analysis has to be done – something that is required if the details are not stored in the database and analyzed upon request by an admin using script-based actions.
Is there a way to get a report that shows which paths or files within UPM profiles are using the most space so the admin can investigate if it should be excluded from the profiles?
Under the user profile test, we provide information on large files. You can specify the size of the file beyond which it should be considered as a large file, see: https://www.eginnovations.com/documentation/Citrix-XenApp-Servers/User-Profile-Test.htm?Highlight=User%20Profile and https://www.eginnovations.com/documentation/Citrix-XenApp-Servers/User-Profile-Management-Test.htm?Highlight=User%20Profile.
How fast does the monitoring agent refresh the monitoring data?
The frequency at which the agent collects performance metrics is configurable. Administrators can decide how often metrics as well as detailed diagnosis data is collected. Settings are for each check and for each system monitored. So, you can configure production systems to be monitored at one frequency and non-production systems at another.
Many tools collect metrics frequently but do not store these metrics at the same granularity in the database for historical analysis. Unlike these tools, eG Enterprise stores metrics at the same granularity as it collects them, thereby enabling detailed historical analysis of the data collected.
The default metric collection frequency is 5 mins. In most cases, monitoring by the agent is in real-time – for example, CPU usage reported in a 5-min period is not a snapshot in time value, rather it is the overall usage averaged over a 5-min period. The default frequency is determined to minimize data storage and transmission overheads while at the same time it provides sufficient detail about the target environment.
Detailed diagnosis information is also collected along with the metrics and stored in the database, so administrators and consultants can analyze the performance offline without any access to the target Citrix infrastructure.
Another question, is there any reporting function for this product that can have up to 1 year performance data in the database? If there is, is that function included in the base price, or does it have to be a separate module to purchase?
Great question, there is a reporter module that comes with the base product. There is no limit on data stored. There are numerous out-of-the-box reports available including capacity prediction for Citrix, see: Capacity Analysis for Virtual Applications Report (eginnovations.com).
There is a 3-min video overviewing Reporter here: How To Work With eG Out-of-the-Box Reports – YouTube.
What is [eG’s] Standard SLA for technical help required for customer?
https://www.eginnovations.com/it-monitoring/support-services gives some information. For those purchasing enterprise support, we have 11 global support hubs who provide 24/7, online, follow-the-sun support with local phone support available within office hours supporting many local languages. SLAs vary slightly by support level purchased, issue severity, and geography. Our hubs are located in the USA, Singapore, India, Peru, Brazil, South Korea, the UK, The Netherlands, Germany, Hong Kong, and Germany with partners providing support in several other countries such as Japan and the UAE.
What are the options for alerting to teams? (e.g., email, ServiceNow, SMS) And are there thresholds to ensure false alarms are mitigated?
Yes, there are many mechanisms available including email, SMS, SMTP, and via ITSM APIs. Technologies supported include:
Note: These are full product integrations allowing two-way updates. In general, we would not advise opening support tickets via a dumb email to a system such as Jira or ServiceNow. We’ve got a popular blog post about helpdesk integration considerations available: Service and Help Desk Automation Strategies | eG Innovations.
There is also a mobile app for both android/iOS (https://www.eginnovations.com/blog/the-eg-enterprise-mobile-app-android/) so, you can get a small-form-factor-friendly view of alerts rather than the web console John showcased in the webinar. The apps provide a full alert console into eG’s pinpointed root cause analysis, so you can avoid alert storms of messages triggered by metrics crossing dumb thresholds in other products.
Regarding thresholds, eG Enterprise is architected and designed around a powerful AIOps platform designed to scale. Patented Root Cause Analysis (RCA) technologies are leveraged to pinpoint and prioritize single underlying issues to the operator, avoiding alert storms and distractions from secondary symptoms. Thresholds for key metrics and signals are configured out-of-the-box based on industry standard best practices, eliminating the need to manually set and manage thousands of metric thresholds. IT managers can adjust thresholds for metrics based on service level agreements (SLAs). Three levels of thresholds can be set for upper and lower thresholds, allowing for escalation of alerts should a problem worsen in severity. You may like to check out our video: Understanding and Modifying Alarm Policies – YouTube.
For time-varying metrics or metrics that depend on the system configuration (and hence, need to be set specific to each system), eG Enterprise’s machine learning auto-baselining technology is used to enable dynamic thresholds. This technology tracks time of day, day of week behavior of each metric and uses past history to estimate what the upper and lower limits of each metric are likely to be in the future. Administrators can choose the granularity with which they apply this derived intelligence to allow thresholds to be automatically and dynamically fine-tuned.
Minimal expertise is required to configure the solution. If a metric generates too many alerts, administrators have an option to configure “leniency levels” that allow for some degree of variation from the normal thresholds. We’ve also got a 4-min video on YouTube covering thresholds: Understanding and Modifying Thresholds – YouTube.
What is the latest version of eG Enterprise?
The latest shipping version is v7.1.8.
Does this work with or is it a replacement for existing Citrix Performance Analytics?
eG Enterprise is an end-to-end monitoring solution for Citrix infrastructures and can be used in addition to Citrix Performance Analytics. A lot of customers tend to use eG Enterprise to analyze their Citrix infrastructure as well as their applications and non-Citrix estate. George Spiers has written a detailed blog on Citrix Performance Analytics and how it compares with eG Enterprise: https://www.eginnovations.com/blog/citrix-analytics-performance/
I am looking to deploy several agents to monitor Citrix Remote PC. Do I have to install agents manually one by one?
Monitoring of Citrix Remote PC is supported by eG Enterprise. See this blog “How to Monitor Citrix Remote PC” by Barry Schiffer. eG Enterprise provides the same capabilities for Citrix Remote PC as it gives for virtual desktops.
The lightweight VM agents must be installed on each remote PC (not the full-blown eG agent). You can install the VM agents automatically. Integration with any software distribution tool is possible. For instructions on performing the VM agent installation automatically through Microsoft SCCM, see here. eG agents and VM agents can also be installed through Citrix Provisioning. A guide for this process is available here: https://www.eginnovations.com/documentation/eG-Installation-Guide/Installing-an-eG-Agent-on-a-Citrix-PVS-Gold-Image.htm.
How could your single pane solution for end-to-end Citrix monitoring help end users complaining of less than great experiences? How much information can you share? Thanks!
The Citrix User Experience dashboard helps drill in and identify users having less than optimal user experience within Citrix. There is a nice overview of how this works on this blog: Citrix Real Time User Experience Monitoring | eG Innovations. We have also integrated with the Citrix Connection Quality Indicator which can be extremely useful in these scenarios: Citrix Connection Quality Indicator for Administrators | eG Innovations.
As a single pane solution, eG Enterprise includes a comprehensive context-sensitive embedded help knowledgebase – so helpdesk staff have a full explanation of metrics rather than obtuse names, the thresholds set and why, plus advice on what common issues are and how to resolve them. This means that frontline helpdesk does not have to be Citrix domain experts and can interpret alarms and events without the need to google Citrix documentation or access other consoles such as Director. There’s a quick overview video of the embedded help here: How To Leverage Help in eG Enterprise – YouTube
Can this end-to-end Citrix monitoring tool monitor end-user ISP issues, for example if the user is in Asia or Africa and if the bottleneck is at an ISP, can this tool pinpoint that?
eG Enterprise can definitely help identify if there are network latency issues on the user endpoint side. Using metrics collected and reported by the Citrix stack, using their APIs, eG Enterprise reports on the network latency between the VDA/VDI and the user’s terminal in their remote location. If the network latency is high, clearly the issue is not because of the Citrix infrastructure, but it could be due to the network in the user’s home, or their connectivity to the Internet. Additional diagnosis can be done to isolate the real problem. eG Enterprise’s ability to provide this detail without needing agents on every user terminal is a big advantage for administrators.
We’ve also included geographical information about Citrix end users for a while, so you can see maps of where users are connected from and identify regional issues and outages, see: What’s New in eG Enterprise v7 (eginnovations.com).
Is there a report or dashboard that can be made available for desktop users to see what might be impacting their experience?
The eG Enterprise user experience dashboard provides an overview of the performance seen by all users. Drilldowns provide detailed performance insights for individual users. The individual user dashboards can be integrated into enterprise portals/other dashboard tools, so a user may be able to see the performance of their virtual desktop/session and see if anything they are doing in the session is affecting their experience. You can read more about this on our blog: https://www.eginnovations.com/blog/virtual-desktop-dashboard/
If you still have questions or want to learn more, these links might help:
- Want to kick the tires with a free trial? See here: IT Performance Monitoring Trial | eG Innovations
- Read some of our customer case studies: Case Studies | eG Innovations
eG Enterprise is an Observability solution for Modern IT. Monitor digital workspaces,
web applications, SaaS services, cloud and containers from a single pane of glass.
eG Enterprise is an Observability solution for Modern IT. Monitor digital workspaces,
web applications, SaaS services, cloud and containers from a single pane of glass.


