User experience determines the success of Citrix and virtual desktop initiatives. If users do not experience similar or better performance from these infrastructures, support incidents will rise, user satisfaction will fall and productivity will suffer. In the worst case, with inadequate attention to the user experience, even the most strategically sound Citrix/VDI rollout can fail.
In this second installment of “It’s All About the User,” we discuss how to effectively monitor the user experience in Citrix and virtual desktop infrastructures to maintain top performance and user satisfaction. For a complete breakdown of what constitutes good user experience in Citrix/VDI, see our first article in the series.
Common Approaches for User Experience Monitoring
There are four main approaches for tracking the user experience in Citrix/VDI infrastructures:
1. Monitoring at the Client Devices
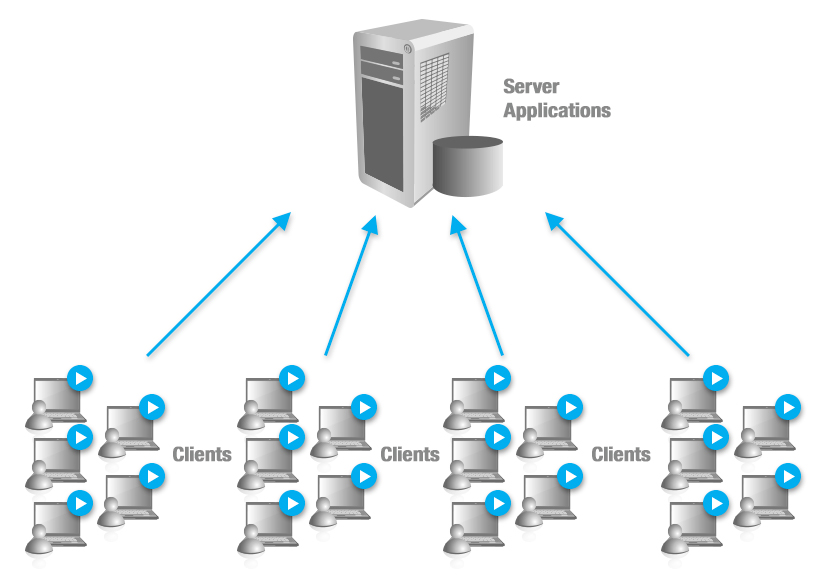
In this approach, software agents are deployed on each client device (laptops, desktops, thin clients), which record traffic to and from the device. Analyzing traffic metrics, performance reports highlighting the user experience can be produced. Depending on the capabilities of the agents, the reports can be granular and most aspects of user experience can be tracked. Aternity is a performance-monitoring vendor whose technology uses this approach.
2. Monitoring at the Network
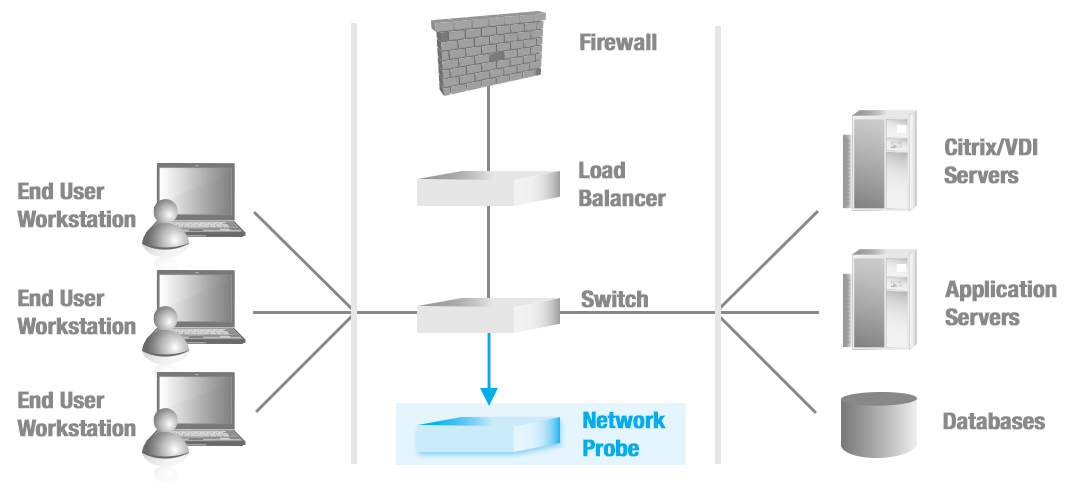
Deploying agents on every client device is not always practical or preferred, so software or hardware probes deployed on the network can be used instead to analyze packets transmitted by clients and from the servers. This data can then be used to analyze the VDI or Citrix user experience. ExtraHop is an example of technology that employs this approach.
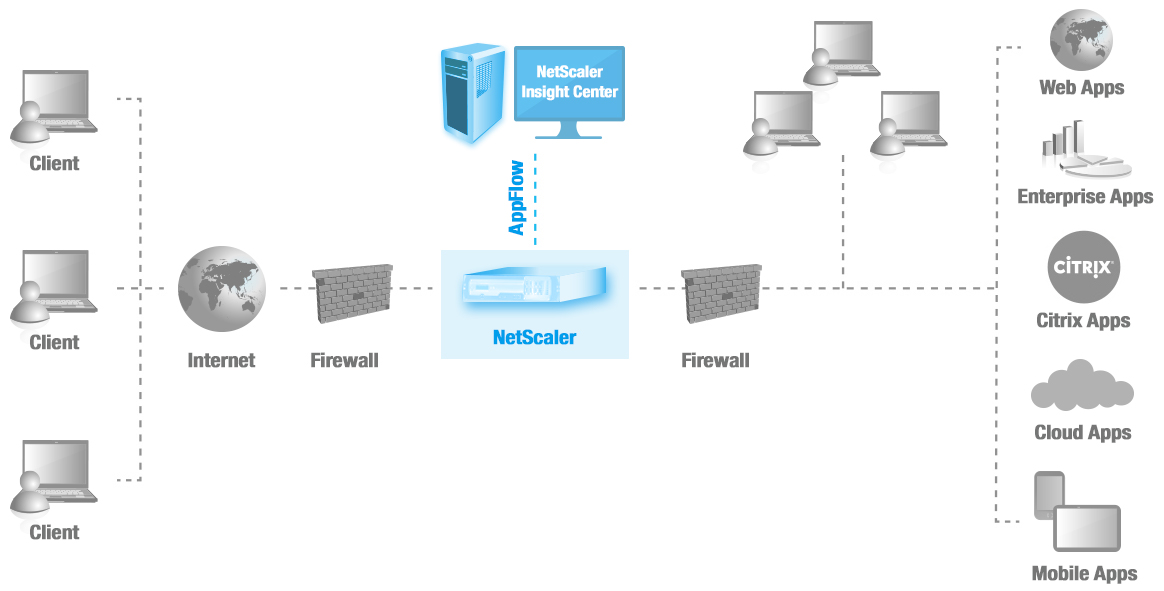
Citrix’s NetScaler Insight technology uses this approach. AppFlow data from NetScaler devices can also be exported for third-party vendors and their tools to process the packet data and report on the user experience.
3. Monitoring at the Servers
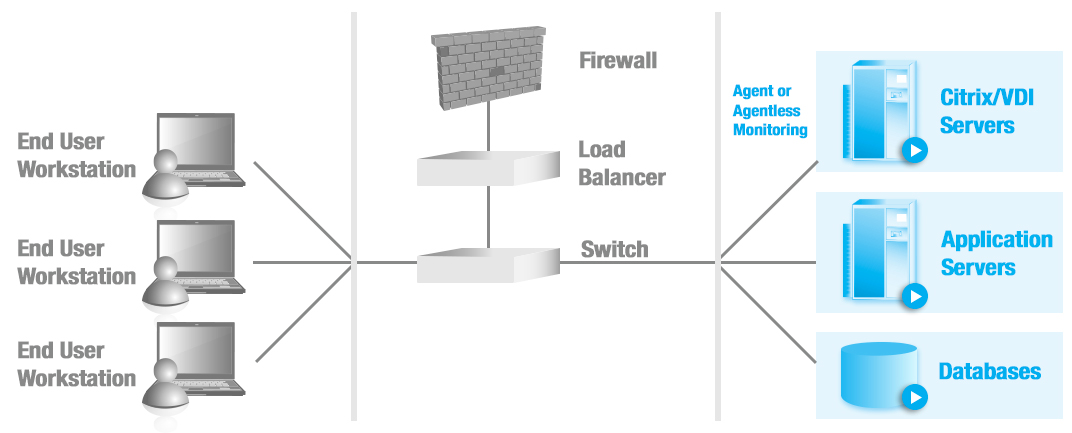
Since Citrix/VDI access is connection oriented (TCP-based) and much of the processing is in the data center – rather than on the user’s desktop/terminal – extensive details about the performance of the Citrix/VDI service can be obtained with instrumentation in the data center alone. Software agents deployed on servers interface with the applications, virtual desktops, server operating systems, etc. to report performance metrics. User logon times, application launch times, screen refresh latency, application errors, and more can be effectively reported with this approach. The session servers for Citrix XenApp / VMware RDS or the virtual desktops for Citrix XenDesktop and Omnissa Horizon are the main locations from which these user experience metrics can be collected.
In this approach, if slowdowns are being caused by activity or bottlenecks on a specific user’s terminal, this will not be captured. Therefore, it is ideal to augment a server-monitoring approach with on-demand agent deployment to troubleshoot a user/terminal where slow performance persists over time.
4. Synthetic Monitoring
 All of the above approaches focus on monitoring accesses by real users. But how can user experience monitoring occur when there is no traffic to the server farm? This is where synthetic monitoring fits in. This approach relies on emulating repeated user access to the Citrix application or virtual desktop using a robot. The robot periodically emulates user sessions and measures the availability and response time for the access.
Multiple step interactions – for example, a user logging in, launching an application, performing tasks in the application and then logging out – are recorded and played back. To enable accurate diagnosis in the event of a problem, the success or failure of each step and the response time for each step of the multi-step interaction are measured.
[Note: Some synthetic monitoring tools rely on protocol-level emulation – for example, sending an ICA request to a XenApp server or a XenDesktop VM. But for the most accurate synthetic monitoring results, the robot will invoke the same client applications that users use to access the Citrix/VDI service (Citrix Receiver, for one).]
Comparing the User Experience Monitoring Approaches
The table below summarizes the tradeoffs between the different approaches for Citrix/VDI user experience monitoring.
| User Experience Monitoring Approach | Capabilities | Limitations |
| Monitoring at Client Devices |
|
|
| Monitoring at the Network with Network Probes |
|
|
| Monitoring at the Network with Built-in Network Instrumentation (e.g. AppFlow in NetScaler) |
|
|
| Monitoring at the servers / virtual desktops |
|
|
| Synthetic monitoring of service performance |
|
|
Conclusion: Combining Approaches for 360-Degree Monitoring
As you can see from the above table, each approach to user experience monitoring for Citrix and VDI services has advantages and downsides. And, no single approach by itself is sufficient to ensure good user experience, so a combination of approaches must be adopted to get a complete view of user experience and to troubleshoot problems quickly when they occur. In summary:
- Monitoring from the servers is a must. Since Citrix and VDI involve a substantial amount of server-side processing, without visibility into server-side processing bottlenecks that impact the user experience cannot be detected and fixed.
- Monitoring from the network is a must. Among the two monitoring approaches for the network, using AppFlow data avoids the need to install separate probes. Further, it leverages existing investments in Citrix NetScaler technology.
- A judicious deployment of synthetic monitors is important to augment server + network monitoring. Synthetic monitoring provides a consistent external measure of performance, and excels as a proactive indicator of issues when there is no workload on the servers.
- Client-side instrumentation is important – but on an as-needed basis. Although client-side instrumentation is useful, the effort and cost involved in deploying agents on client devices is an important deterrent as a primary user-experience monitoring approach. Moreover, a problem in a client affects only one user, whereas a problem in a server impacts hundreds of users, so scalability is an important factor. However, when an individual user experiences persistent performance problems in isolation, deploying client-side instrumentation is an important tool to get more visibility into that user’s performance and solve his/her problem.
For our next article in this series, we’ll break down the defining elements that constitute user experience in web applications.
Additional Reading : Monitoring Citrix Real User Experience: See What Performance Your Users Are Getting.
eG Enterprise is an Observability solution for Modern IT. Monitor digital workspaces,
web applications, SaaS services, cloud and containers from a single pane of glass.


