Today I’ll give a brief overview on monitoring and troubleshooting Nerdio, a .NET application, popular with MSPs (Managed Service Providers) and enterprises using Microsoft Azure Virtual Desktop (AVD). Nerdio is a cloud-based application used by administrators to automate the deployment and management of virtual desktops in Azure. Nerdio Manager is the application an EUC (End User Computing) administrator uses to simplify tasks such as deployment, scaling, and management of virtual desktops within the Microsoft Azure ecosystem.
Why Should I Monitor Nerdio Manager?
Nerdio Manager is a key tool for the operation of Azure Virtual Desktop technology. If Nerdio Manager is down, or is slow to respond, AVD operations will be affected. You may face:
- Provisioning Issues: Won’t be able to create, update, or delete VMs, host pools, or user assignments. Any scheduled tasks related to scaling or maintenance will not be executed.
- Scaling Issues: Automated scaling operations, e.g., powering on or off VMs based on usage, may not function, leading to higher costs or service disruptions.
- Session Management Problems: May not be able to manage user sessions, log off inactive users, or shadow sessions for support purposes.
- Performance Issues: If scaling operations fail, users might experience degraded performance due to insufficient resources.
- Having to use Manual Interventions: Admins might need to manually intervene to manage resources, perform scaling operations, or troubleshoot issues, which could increase the risk of errors and operational overhead.
Nerdio Architecture
Nerdio is a typical cloud hosted multi-tier application. As with all your cloud-based apps, that you rely on for key workflows in your business, there are a few key things you’ll want to be proactively monitoring, you’ll probably want to:
- Monitor Azure Resources used by the Nerdio Manager like you would any other web application deployed on Azure (App, Key Vault, Database, etc.)
- Track and alert on Nerdio Manager Health status
- Use transaction tracing to identify any issues with the application. Nerdio Manager is a standard .NET application, so adopting APM (Application Performance Monitoring) tools with these capabilities is becoming increasingly common as folks rely more and more on cloud-based tools.
- Monitor the Nerdio Manager’s database backend to detect any need for any proactive maintenance.
Although I’ll use Nerdio as an example, this is really an article about how you can monitor all your critical cloud-based apps whether they be .NET, Java, PHP or Node.js.
Monitoring Nerdio
eG Enterprise is unusual amongst tools used by EUC and digital workspace administrators (for monitoring AVD / Citrix / Omnissa) in that it offers converged infrastructure and application monitoring and offers APM capabilities. Other APM tools such as Dynatrace, AppDynamics and Datadog tend to lack EUC domain-aware features so aren’t very widely used by AVD / VDI administrators.
Monitoring the Nerdio Manager App
You can get some basic health information about the Nerdio app (and all your other apps) by monitoring the Azure Subscription and the “Azure App Services”.
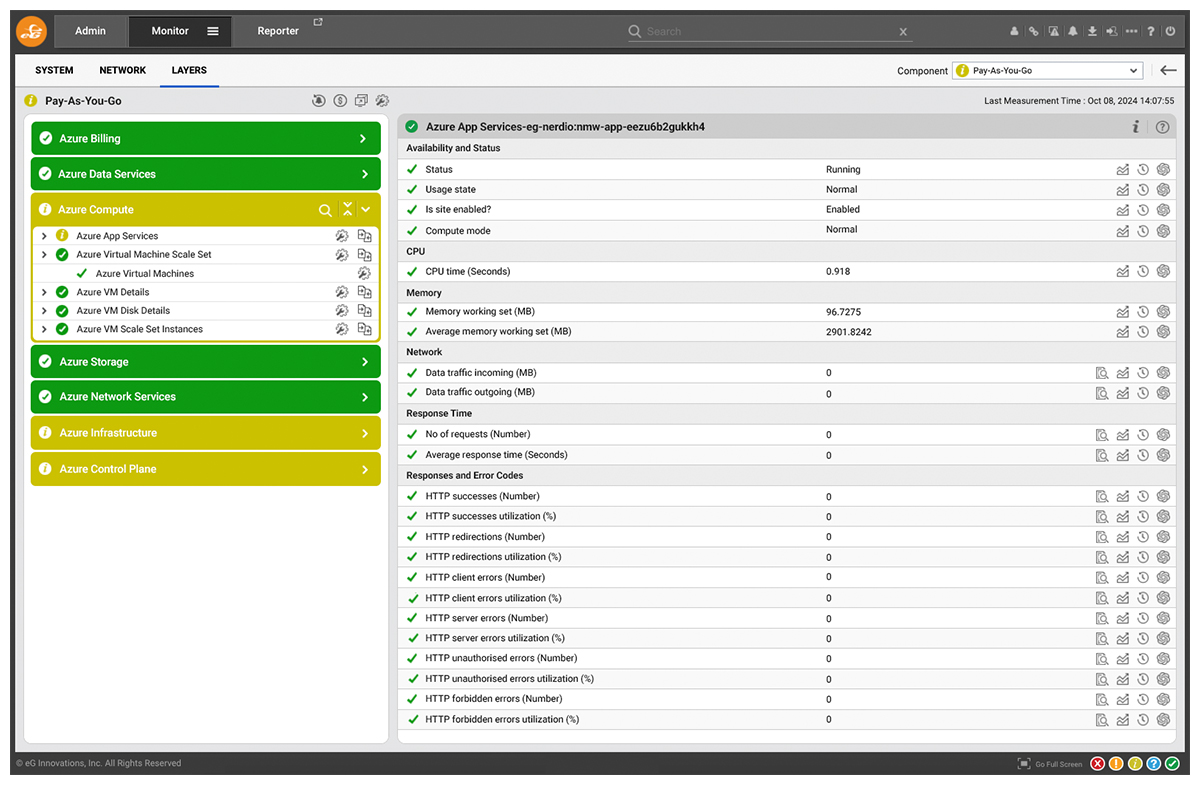
In Figure 1, you can see all the metrics and events that eG Enterprise has configured automatic monitoring and alerting for. Note that there is enough information to:
- Check basic availability and status
- Track if the Nerdio Manager app is using too much CPU /memory
- Monitor requests to the app and response time
- Track if there are many HTTP errors during access to the application
- Determine if the Nerdio Manager app is oversized/undersized for your workload
Monitoring Nerdio Manager Health Status
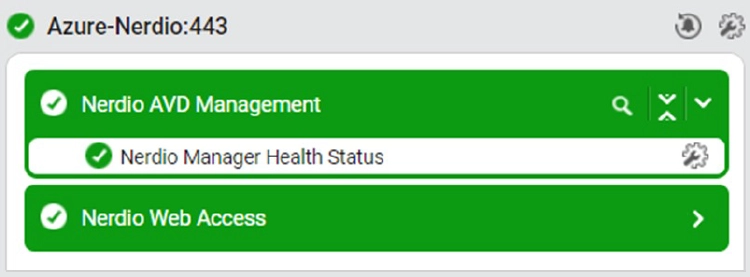
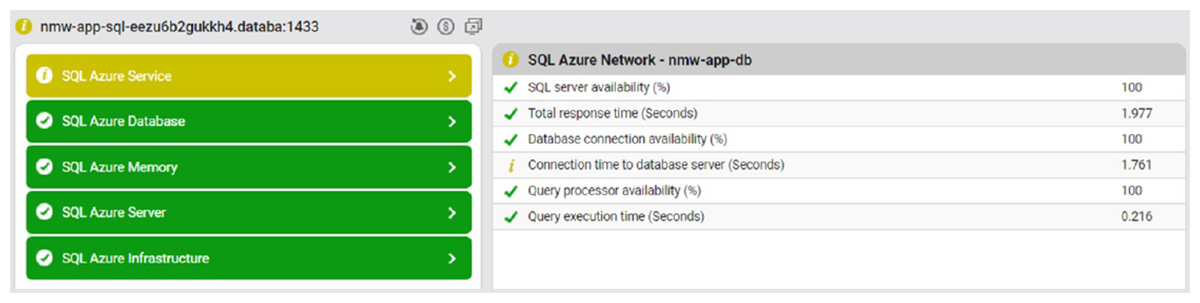
Within eG Enterprise the Nerdio Manager component model tracks the health of the Nerdio Manager.
The SSL certificate check tracks expiry days for the Nerdio Manager’s certificates.

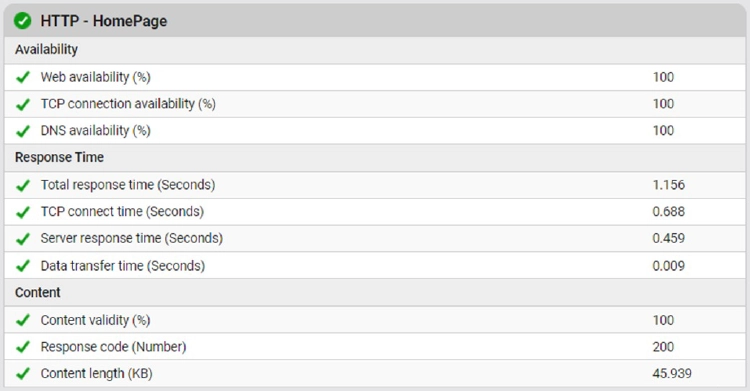
The HTTP test checks the availability and responsiveness of the Nerdio Manager.
You can integrate with Nerdio Manager Health check API to monitor the functioning of the application.
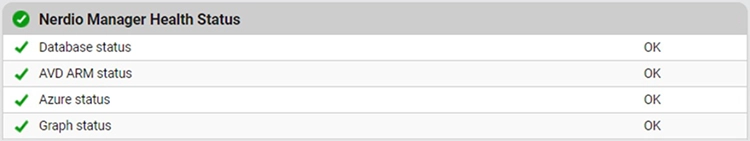
This ensures that Nerdio Manager’s app service has connectivity to the SQL DB, Azure, and the AVD services. If there are any blocks, service unavailability, or networking issues, the health check indicates this. You can check the Nerdio Manager logs for further troubleshooting.
Monitoring Nerdio Related Azure Resources
When the Nerdio Manager application is installed, it creates certain resources in Azure the including: SQL Server and SQL Database (S1), App Service Plan and App Service (B3), Key Vault. Some information on the defaults can be found, here: Nerdio Manager Default Deployment Resources and Costs – Nerdio Manager for Enterprise (getnerdio.com).
Monitoring Azure Key Vault
From the Azure subscription you can also track the availability, responsiveness and operations on the Nerdio Manager’s key vault. See Figure 6 – a screenshot from eG Enterprise showing the data you can monitor.
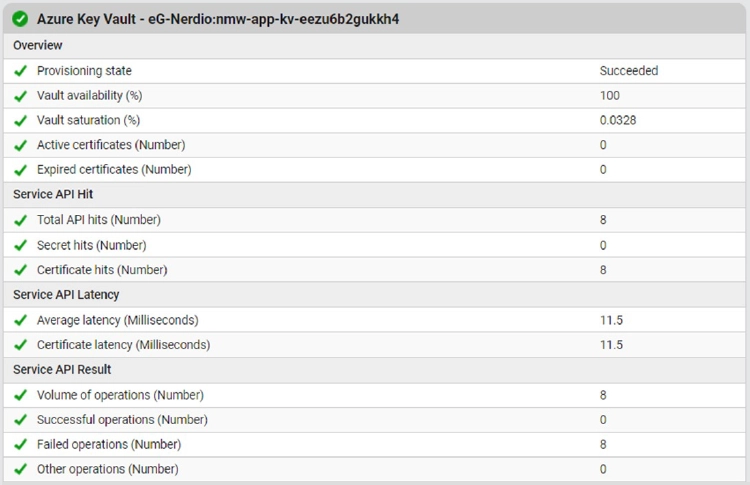
If you aren’t familiar with Azure Key Vault metrics, logs and events, see: Monitor Azure Key Vault | Microsoft Learn. If you’d prefer to go down the manual monitoring with Azure native tools route, information is available on the same site on how to set up monitoring for Azure Key Vault.
Right-size Nerdio’s Database
You can also monitor the Nerdio Manager’s Azure Database status, connections, size and resource utilization levels to detect any bottlenecks for database access. See figure: 7.
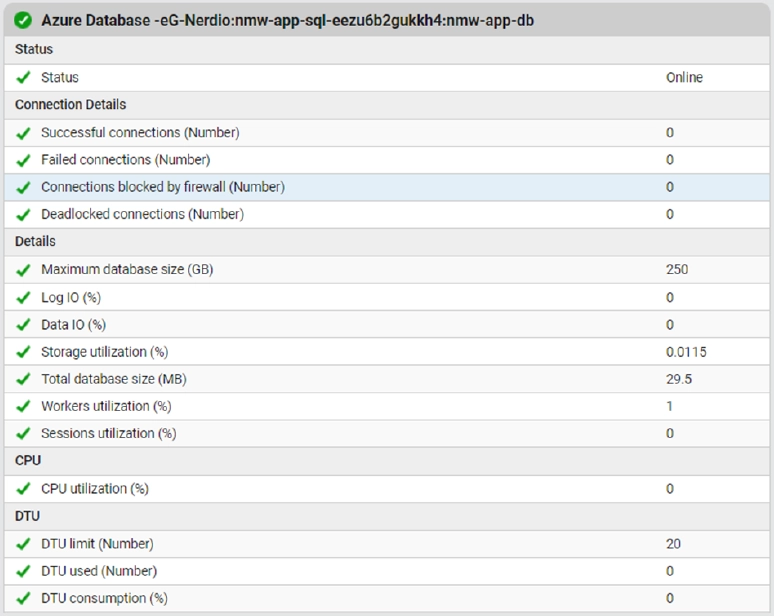
Nerdio recommend scaling up to a SQL database with 100 DTUs (default is 20 DTUs as shown in the last screenshot) and the App Service plan to at least a S3 or P2V2 when you are managing 200+ AVD session hosts. So, if you are in the zone where you suspect bottlenecks actual data DTU usage is useful information that can save you unnecessarily upgrading Azure dependencies.
Monitoring Nerdio Manager Database
You can use eG Enterprise to monitor Nerdio Manager’s SQL Azure database in an agentless manner. This will allow you to track slowdowns, deadlocks, top queries, sessions, waits and more to identify database bottlenecks.
There may be little you as an end-user can do to resolve such issues. However, collecting this data when troubleshooting Nerdio issues will allow you to pass the issue into Nerdio support. Often end-users use products in slightly different ways to how the vendor has designed or tested them. We see vast quantities of customers use eG Enterprise to identify inefficient SQL (especially in Java healthcare apps – but that’s one for another blog!).
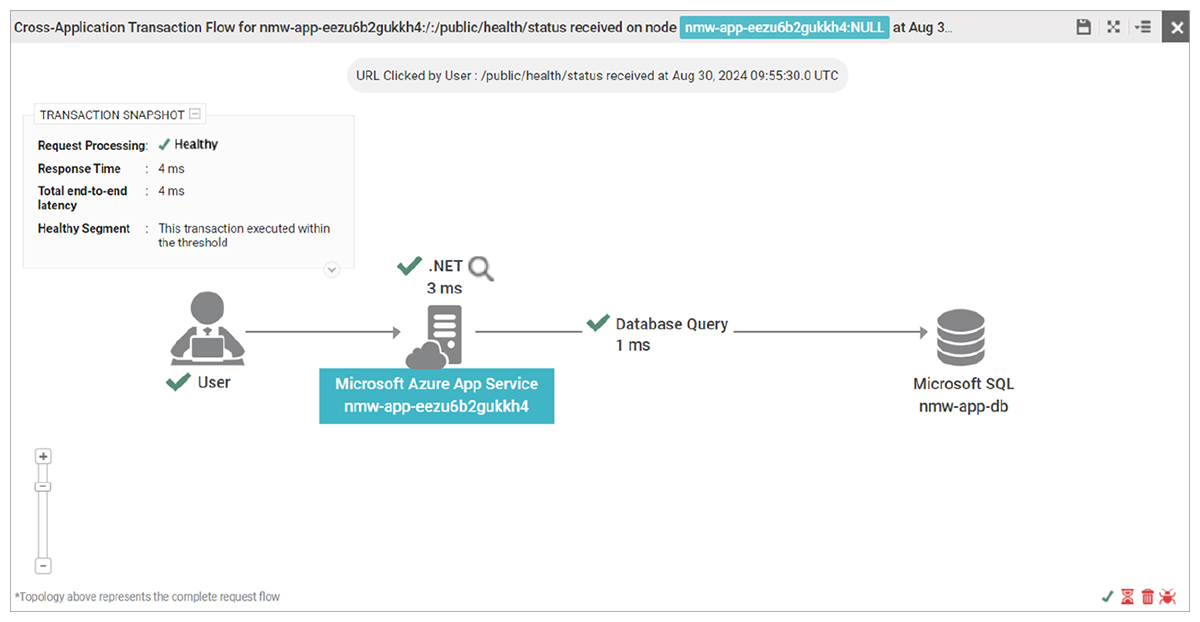
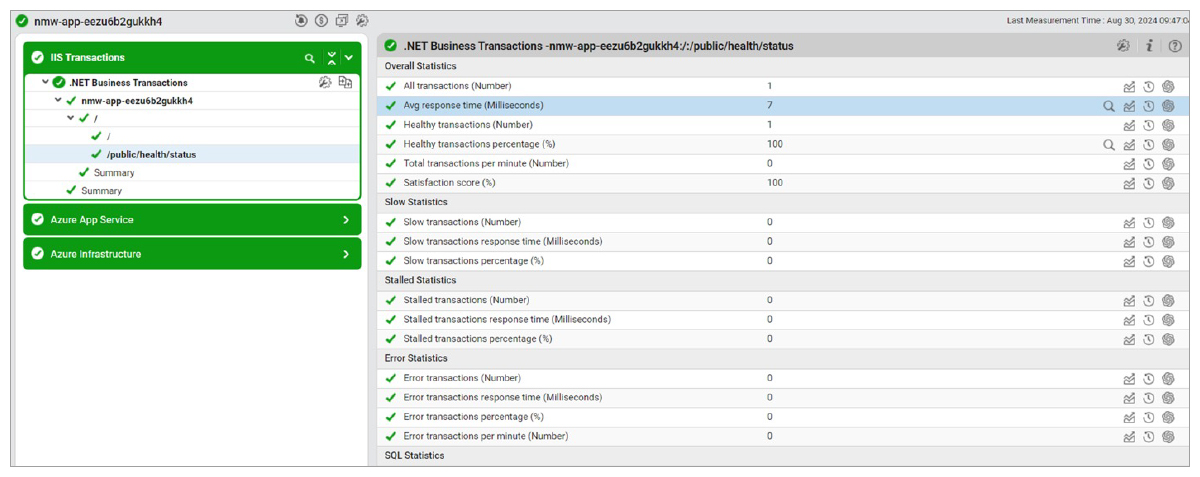
Monitoring Nerdio Manager Transactions
Nerdio Manager uses .NET technology. eG Enterprise Business Transaction Monitoring for .NET applications can be used to track transaction health, if required when troubleshooting Nerdio. Distributed transaction tracing is a technique used in eG Enterprise to identify code-level issues without code changes (i.e. suitable for third-party apps like Nerdio) – Learn more: What is Distributed Tracing? Use Cases and How it fits into APM & Observability | eG Enterprise (eginnovations.com).
AIOps (Artificial Intelligence for IT Operations) for EUC
This example of monitoring Nerdio demonstrates what tools designed for more than just digital workspaces and with APM capabilities offer. The powerful AIOps (Artificial Intelligence for IT Operations) engine within eG Enterprise means monitoring is auto deployed as your systems scale. Monitoring, metric thresholds and alerting are set up out of the box and the platform auto-baselines your specific deployment and applications.
Basic EUC tools usually offer to monitor a handful of metrics (maybe 500 at best) which limits visibility. AIOps allows eG Enterprise to handle and continually monitor hundreds of thousands of metrics, logs and traces. As we saw above, even monitoring a simple .NET solution like Nerdio requires you to monitor all the Azure dependencies and the number of metrics you need soon adds up.
Some information on including APM within an app-centric strategy for EUC is covered in Application-Centric EUC Monitoring is Key to Digital Employee Experience (DEX) | eG Innovations.
Final Thoughts on Nerdio Troubleshooting and Monitoring
If you came here hoping to find out how to use Nerdio to deploy eG Enterprise, you probably want to check out: Using Nerdio Manager to Deploy eG Enterprise for AVD Monitoring (eginnovations.com). Further information on eG Enterprise’s integration with Nerdio is available, here: Nerdio Manager: Simplify & Refine AVD Deployment & Operation (eginnovations.com).
A significant issue when leveraging cloud-based apps occurs when the cloud or its portal goes down. There’s some information on how you can ensure observability on Azure or other cloud outages available here: How to Protect your IT Ops from Cloud Outages (eginnovations.com).
Extend to Monitor Other SaaS/Cloud Applications
Think about all those SaaS tools and Azure hosted apps and services you rely on. The overall methodology highlighted here applies for any cloud hosted SaaS application. A SaaS application can be monitored in many different ways:
- Up/down availability,
- Resource footprint on the cloud,
- Detailed insights into transaction performance,
- API integration for health monitoring,
- Monitoring its dependencies (e.g., databases)
No more “little black-boxes” in the cloud! No more paying for resources to support SaaS that you don’t actually need! And far less arguing with SaaS vendors as to whether any problem lie within their particular little black-box!
eG Enterprise is an Observability solution for Modern IT. Monitor digital workspaces,
web applications, SaaS services, cloud and containers from a single pane of glass.
 Karthik Ganesan is a Systems Manager at eG Innovations, he has worked out of our R&D office in Chennai for over 10 years. Karthik started his career as a hands-on network engineer and has particular empathy for those involved in frontline customer support.