IT Monitoring Dashboards and Portals
 Managing the end-user experience has become the basis of competition in the digital services world. Most IT organizations today are looking for a portal for managing the performance of digital business services – and a portal is much more than a simple dashboard.
“If you make customers unhappy in the physical world, they might each tell six friends. If you make customers unhappy on the Internet, they can each tell 6,000 friends.”
— Jeff Bezos
What are IT Performance Dashboards?
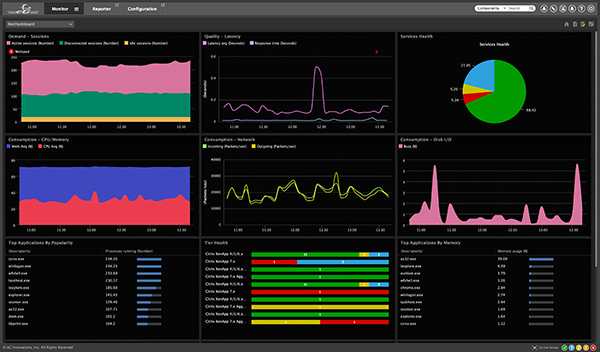
From a performance monitoring perspective, dashboards provide at-a-glance views of key performance indicators (KPIs) for pretty much any part of IT that’s of interest to a user. Some of the key capabilities of dashboards are listed below:
- Dashboards are often highly personalized with various charts, gauges, and graphs depending on the user’s role and current focus.
- It’s important that users can quickly create and personalize dashboards, so they can get a real-time view of performance. Dashboards should be easily configured and tuned to the user profiles and personas needed by the organization.
- Dashboards should be able to aggregate real-time metrics as well. For example, getting farm-wide views that provide the total number of users or the average CPU utilization across all servers.
- Often, dashboards are used in network operation centers (NOCs) to display key performance indicators of interest to the helpdesk/operations teams.
 Example of an IT performance monitoring dashboard
The limitation of performance dashboards is that they present an overview of performance but lack the drilldowns and contextual insights needed for IT operations to take the next step and resolve problems quickly. While dashboards present a lot of data, they leave the task of analyzing and correlating performance information to the operators. In most production environments, this is not sufficient for effectively assuring end-user experience and digital service performance.
A dashboard’s inability to automate the diagnosis of performance issues and integrate this into a user’s workflow may be like putting lipstick on a pig. It looks great until you have to drill down and actually figure out what’s going on ‘behind the curtain.’
A dashboard is the result of step six in ITIL’s seven-step improvement process. It takes data that’s been transformed into information and presents it in a format that is understandable, at the right level, provides value, notes exceptions to service and allows those receiving the information to make strategic, tactical and operational decisions based on their role.
What are Performance Portals?
A performance portal goes well beyond just a pretty display of the collected metrics. A portal is a framework for integrating people and processes across organizational boundaries. Dashboards are often part of a portal’s “front-end” and are what the end users see to get a quick look at how things are performing. But the users that create dashboards are engaged in activities, often as part of a cross-functional team.
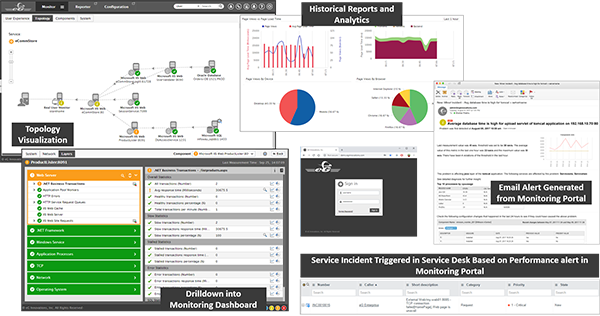
What happens in the background (i.e., ‘behind the curtain’) is also part of the portal, and from a performance monitoring perspective this is a critical distinction. For example, an effective dashboard should be “active,” i.e., you should be able to click on a chart or graph and immediately drill down to related information and detail.
Portals that require constant ‘eyes-on-glass’ and cannot automatically adapt thresholds wind up being an impractical solution. To be truly proactive, an effective performance monitoring portal needs to be able to automatically analyze historical values of metrics and learn their normal values.
Some IT performance monitoring portals also can display topology maps of digital services. To effectively provide automated diagnosis of performance issues, the monitor must include inter-application dependencies, virtual dependencies (i.e., virtual machine-to-physical machine, application-to-virtual machine) and dynamic dependencies (i.e., movement of a virtual machine within a cluster).
 Example of an IT performance monitoring portal
The portal should use this dependency information to automatically isolate performance issues for all stakeholders, regardless of what dashboard view users have configured. This situational awareness is key to cross-functional collaboration and organizational process effectiveness.
Performance portals go beyond just reporting issues. Their goal is to make IT performance monitoring effective – they tie into asset management systems, CMDB systems, and integrate with trouble ticketing and workflow systems. All in all, by providing the necessary context and capabilities, performance portals enable IT operations to do their job – quicker, faster and better.
Find out how IT performance monitoring delivered cost savings and rapid problem remediation at a major manufacturing company.
i ITIL Continual Service Improvement
ii Wikipedia
eG Enterprise is an Observability solution for Modern IT. Monitor digital workspaces,
web applications, SaaS services, cloud and containers from a single pane of glass.

