 In this article, we will cover a case study of one of our higher education customers using eG Enterprise for proactively monitoring Moodle applications and troubleshooting them to ensure service availability and performance for their staff and students.
What is Moodle?
 Moodle is a free and open-source learning management system (LMS) and course management system (CMS) written in PHP and distributed under the GNU General Public License. The system is used to construct VLEs (Virtual Learning Environments) and create online curricula and courses widely used by traditional educational institutions
It is also used to deliver training materials for commercial organizations. For example, with Moodle, you can easily create courses, where each course has a number of resources and activities. A resource might be a PDF file or an external link on the web relevant to a course being taught. An activity might be a forum, a quiz or a wiki. Within a course, resources and activities can be organized into logical topics or into weeks on a calendar.
Facilitating Online Education and Collaboration
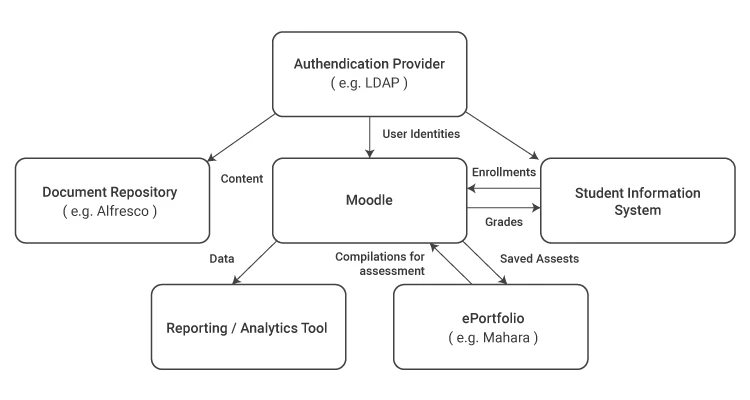
Moodle is one of many components of the online education system of an educational institution. Figure 1 depicts the other systems that Moodle interacts with:
- An authentication/identity provider (e.g., Active Directory or LDAP) is used to control user accounts across all the institution’s systems.
- A student information system (SIS) is a database of all students, which programs they are studying and what courses they need to complete, as well as a summary of all the courses they have completed.
- A document repository (e.g., Alfresco) to store files and track workflow as students and teachers collaborate.
- An ePortfolio where students can assemble assets, build a CV (resume), and provide evidence that they have met the requirements of a course.
- A reporting or analytics tool.
Moodle is open source or free software (GPL). It is written in PHP and runs on most common web servers like Apache, Nginx, etc. It requires a database, and can be used with MySQL, MariaDB, PostgreSQL, Microsoft SQL Server or Oracle.
Why is Moodle Monitoring Important?
Many educational institutions have built their course delivery around the Moodle platform. It is now a core service critical to delivering on their commitments to students. With the necessity of remote learning throughout the pandemic, it has become increasingly important for educational institutions to ensure high-availability.
Additionally, schools needed performant access to Moodle but the ability to collect data continually. The final requirement was tracking KPIs (Key Performance Indicators) to demonstrate that they are continually meeting their commitments to student services.
Two aspects govern the efficiency of an LMS/CMS: the user interface and the system’s performance. If the interface is logically designed and intuitive, then users will quickly learn it. If the application is performant and responds quickly to user actions, then they will remain focused on their activities.
Performance is mainly measured by latency or page load time. Load time is the length of time between a user action (e.g. clicking on a link) and the corresponding response is received (being shown the page the link refers to). Continuous monitoring can detect abnormal situations and allow the Moodle administrator to take remedial action. Historical usage and performance metrics can be used to generate trends and used for effective capacity planning.
Since web server logs have details of each request and the time taken, by analyzing the logs, it is possible to determine that Moodle is slow. However, it is not simple to determine why the slowdown may have occurred.
Key Components of a Moodle Application Deployment
Figure 3 below shows the different components supporting a Moodle application deployment.
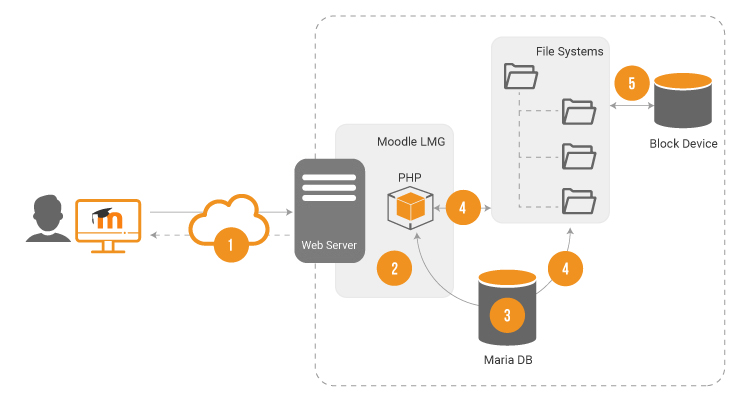
The user request is sent over a network to a web server (2). The web server receives the request and passes it to Moodle. Moodle then parses the request and determines the actions it needs to take to fulfill the request.
Normally this involves creating an HTML document from the result of several queries to a backend database server – in this example, a Maria database server (3). The database server parses the queries from Moodle and searches its datastore (4). The data files and other static artifacts (e.g., images) are accessed via a file system which is stored on a hard drive (5).
There are a variety of factors that may impact Moodle performance. These include the network connectivity of the user, the performance of the webserver, processing bottlenecks in the Moodle application, or slowness in the database server or in the file system/storage device used. End-to-End monitoring is required to get a handle on the performance of each tier. Additionally, it will help to pinpoint the reason why a Moodle application may be slow.
eG Enterprise: Providing End-to-End Moodle Application Monitoring
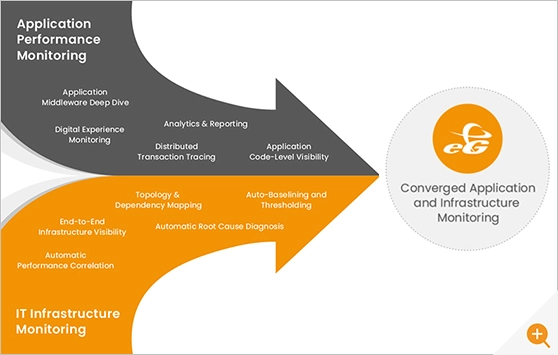
eG Enterprise is ideally suited to address the monitoring requirements of educational institutions that are reliant on Moodle applications. With eG Enterprise you get converged application and infrastructure monitoring from a single pane of glass:
- Perform synthetic monitoring of Moodle applications from different remote sites to benchmark user experience and identify any abnormal changes;
- Implement real user monitoring to track actual user activity and identify slow pages, slow locations, etc., proactively;
- Monitor the health of all the underlying infrastructure tiers – the network, the web servers, database, storage devices, etc.
- Get code-level visibility into request processing by Moodle applications, to determine where bottlenecks might lie;
- Automated correlation for root-cause identification and analytics for trending and capacity planning.
Synthetic Monitoring of Moodle Performance
The eG Enterprise Web Application Simulator enables different Moodle workflows to be recorded and played back. The workflows configured simulate sequences of user actions. The simulator begins with login in and then performs a number of common tasks such as registering for classes and accessing content. Synthetic monitors can be set up from different geographic locations, including on campus, satellite campuses, and remotely from both local and out-of-state locations.
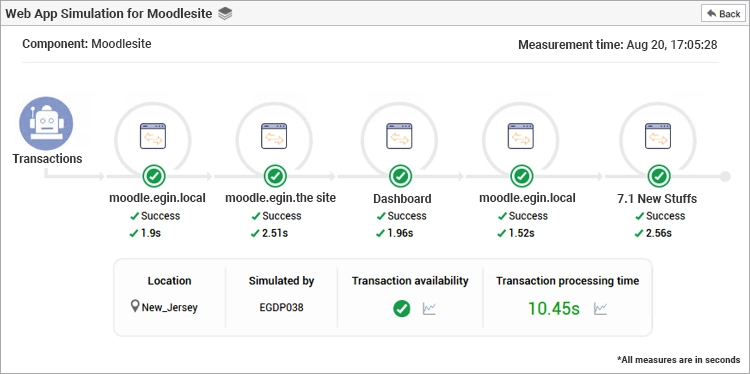
Simple color-coded overlays indicate the health of each step of the workflow. When errors or slowdowns occur, components will turn red, and alerts are triggered.
The eG Enterprise Web App Simulator is a purpose-built tool for synthetic monitoring of any type of web application.

- Multi-step transactions from multiple locations are supported, so user experience can be measured by location.
- A Selenium driver-based recording engine is used to record all user interactions – mouse clicks, keystrokes, user pauses, etc.
- A playback engine uses the recorded script for playback, and based on the responses seen, reports the response time and availability of the application. Screenshots are captured on failure.
This synthetic monitor continually simulates real users accessing applications, even at times of the day or night when there may be no real users accessing systems. Failures can, therefore, be detected before real users are affected, and the corresponding services can be repaired before students are affected and IT help desk tickets avoided.
Real User Monitoring of Moodle Applications
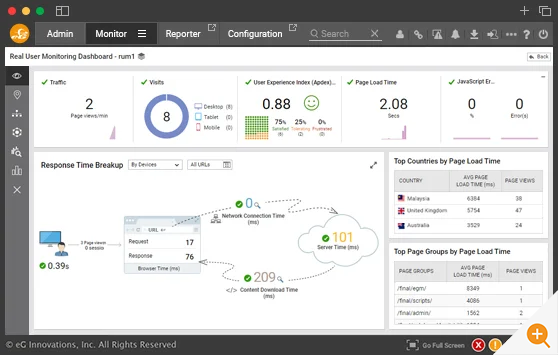
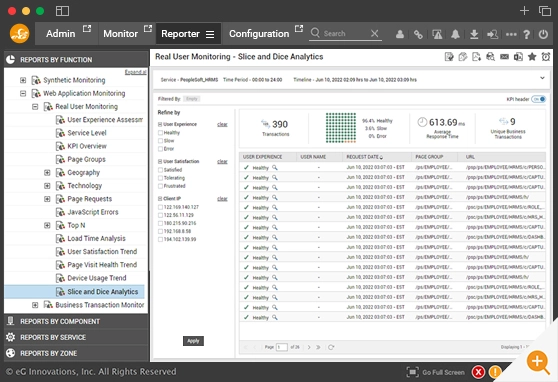 Using Javascript injection, eG Enterprise monitors the real experience of users when they access Moodle applications. The monitors detect page load time, Javascript errors, slowness of specific URLs, or from specific locations, and steps taken to mediate the issue.
While synthetic monitoring only simulates a few specific accesses, real user monitoring (RUM) tracks all web pages and all accesses. In this way, it provides a more realistic measure of performance. This monitoring approach exploits the fact that today’s web browsers have extensive instrumentation built-in and collect very detailed information about each page visit by a user.
PHP Application Monitoring
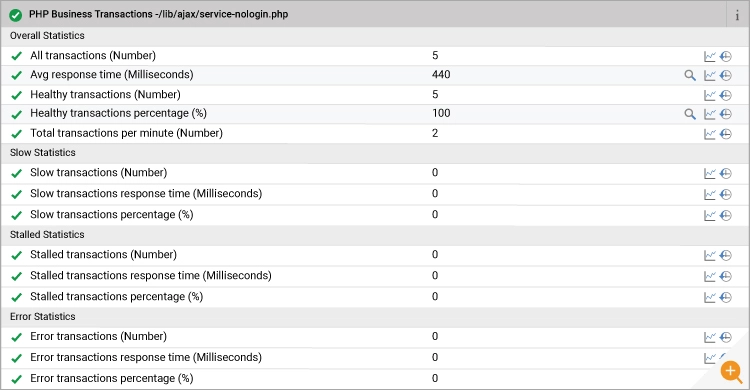
While RUM tells you that user experience may be impacted, if the issue is in the application stack, IT admins need to know where the problem lies – is it due to PHP code, external web accesses, database queries, etc. This is where PHP application transaction tracing comes in. Using instrumentation injected into the application on the server-side, eG Enterprise traces all user requests. Slow requests and details of transaction processing for these requests are collected for further analysis.
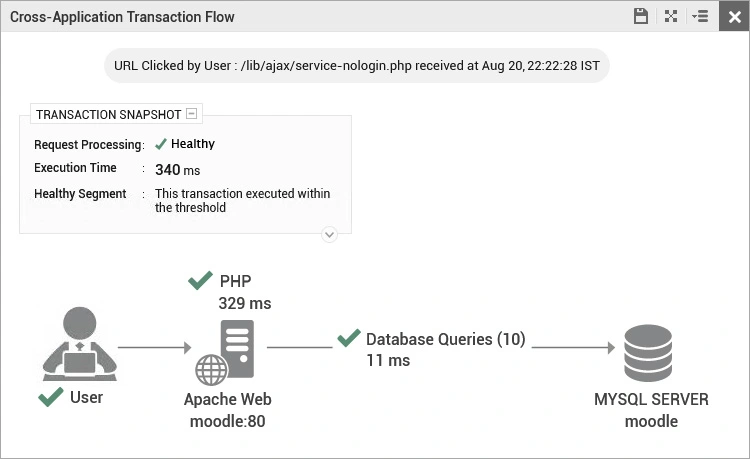
By comparing the response times across pages accessed, IT admins can determine which URLs/pages are slower compared to others.
Web Server Monitoring
Sometimes problems may not be in the application code. The issue can begin with the technologies hosting the application. The Apache/Nginx webserver front-ending Moodle applications need to be monitored. eG Enterprise provides insights into request processing by the web servers, using the webserver APIs. Common questions that can be answered using these metrics include:
- Has the web server restarted recently?
- Has the webserver been configured with sufficient worker processes to handle the incoming load?
- How many requests are currently being processed by the server?
- Has the workload on the webserver changed suddenly?
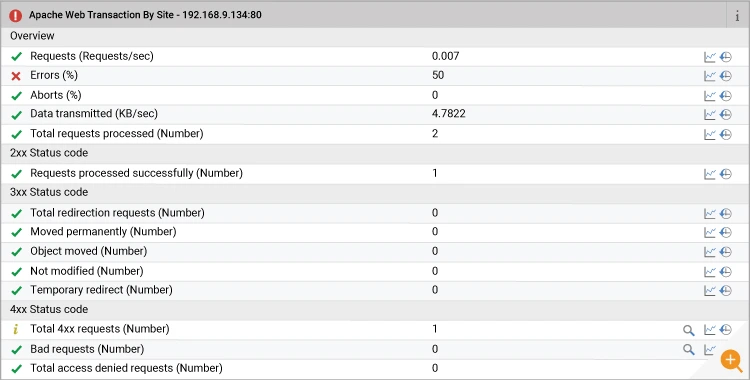
eG Enterprise also processes web server logs to record performance per website accessed. Since requests to the webserver may be for non-PHP pages as well (HTML, images, etc.), the results of this test indicate if there is an issue serving content to users. With the metrics collected with this approach, IT admins can determine if users are seeing many errors.
Similar support is available for other popular web server technologies including Microsoft IIS and Nginx, see: Web Server Monitoring & Performance Monitoring Tools
MariaDB Database Monitoring
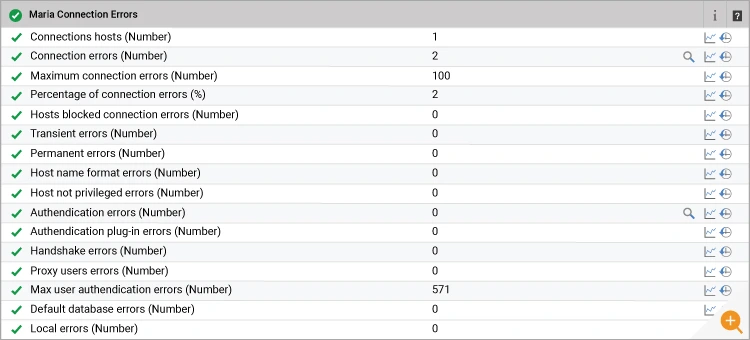
MariaDB is just one of a number of the most popular databases covered by eG Enterprise’s comprehensive suite for database monitoring, offering a choice of both agent-based and agentless monitoring. From the same web console, IT admins can also track the health of their Maria database servers. Slow queries, queries that block other queries, or ones that are running for a long time can be easily detected.
Converged Application and Infrastructure Monitoring with eG Enterprise
Besides the different user experience and application component metrics that eG Enterprise collects, IT admins can also monitor the underlying infrastructure tiers – network, storage, virtualization, cloud, etc. from the same web console. After all, if there is an infrastructure slowdown it will affect the application stack and hence, to pinpoint why a Moodle application is slow, it is imperative to have an end-to-end view of the infrastructure. This is where eG Enterprise’s converged application and infrastructure monitoring from one console helps IT admins of educational institutions.
Color-coded service topology maps make it simple to visualize a Moodle application deployment. Drilldowns are available for each tier so the right IT admin can be involved in troubleshooting, and they have access to real-time and historical performance metrics so they can use empirical evidence to determine how to rectify a problem.

eG Enterprise for Educational Institutions
Many leading educational institutions around the world are using eG Enterprise to monitor the performance and availability of key applications such as Moodle, Blackboard, and Peoplesoft. Universities also widely use remote access technologies like Citrix and Omnissa Horizon. eG Enterprise has specialized capabilities in this area as well.
Proactive IT monitoring is a strategic investment for an educational institution that results in IT efficiencies and improved student and staff satisfaction and overall better educational outcomes. You can learn more about eG Enterprise’s support for Education and our customer case studies on our Education Solutions pages.
To learn more about how eG Enterprise can help your institution, contact us or start your free trial today.
eG Enterprise is an Observability solution for Modern IT. Monitor digital workspaces,
web applications, SaaS services, cloud and containers from a single pane of glass.
Learn More
- Learn more about eG Enterprise for education including more real customer case studies: Education IT Management Solutions & Monitoring Services | eG Innovations
- Apache Web Server Monitoring – see Apache Monitoring & Apache Performance Tools | eG Innovations
- MariaDB Monitoring – see Pre-requisites for Monitoring the Maria Database Server (eginnovations.com)
- PHP – Business Transaction Monitoring, see: PHP Business Transaction Monitoring (eginnovations.com)
- MySQL Monitoring – see MySQL Monitoring & Performance Management | eG Innovations
- Citrix Monitoring Tools for Top Citrix Performance




 Rachel has worked as developer, product manager and marketing manager at Cloud, EUC, application and hardware vendors such as Citrix, IBM, NVIDIA and Siemens PLM. Rachel now works on technical content and engineering and partner liaison for eG Enterprise
