Introduction
For several decades, IT monitoring has been deployed in different forms. The focus of IT monitoring has been to gather metrics about the operations of an IT infrastructure’s hardware and software assets to ensure that all the key functions are being performed as expected to support applications and IT services. In the recent past, the term Observability has been used as a synonym for “modern monitoring”. In this blog, we will discuss what observability is, how it differs from monitoring, and what are some of the key requirements for an observability solution.
What is Observability?
In the past, the term observability has been used in control theory to refer to how the state of a system can be inferred from the system’s external outputs. Applied to IT, observability is how the current state of an application can be assessed based on the data it generates. Applications and the IT components they use provide outputs in the form of metrics, events, logs and traces (MELT). Analysis of metrics, logs and traces is used to estimate the health of the target application.
“Observability is the characteristic of software and systems that allows them to be “seen”, and enables questions about their behavior to be answered. Observability enables organizations to analyze software and systems, based on the signals they emit and to ask questions about their behavior and state.”
Gartner Magic Quadrant for Application Performance Monitoring and Observability, 2022
Monitoring vs. Observability
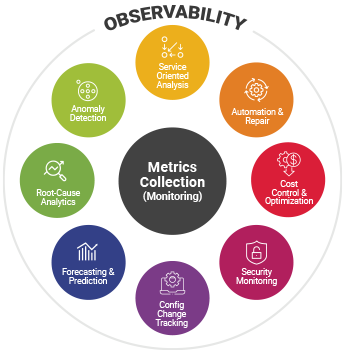
- Monitoring: Tells you when something is wrong
- Observability: Tells you why something is wrong
While monitoring is limited to simply informing you when a change in performance, usage or availability occurs in an IT system (i.e., an anomaly happens), observability provides the details necessary for you to understand why this change occurred. One way to think about the difference is to view monitoring as collecting the metrics, and observability as providing the intelligence and analytics needed to analyze the collected metrics and to determine what actions need to be taken to mitigate a problem.
While monitoring tools have mainly been used by IT operations teams, observability tools are of interest to other functions. Application owners can use them to understand where the bottlenecks lie in a complex application deployment. IT executives use observability tools to understand which areas of their infrastructure may be problematic and what needs to be done to improve user experience.
The term “monitoring” carries a lot of baggage in many organizations. Legacy monitoring tools have often been difficult to install and use, generate a lot of noise (i.e., false alerts) and often end up as shelf-ware. They have also been expensive and not necessarily delivered a lot of value to the business. As a result many organizations are now understandably wary of introducing additional monitoring tools.
At the same time, IT executives are often frustrated by the lack of visibility – it seems they have too much monitoring but very little insight into problems that happen with their applications and infrastructure. Using the term observability, allows modern tools to overcome the traditional baggage of monitoring tools and to get stakeholders beyond IT operations teams to use these tools. Observability can be used as a framework to assess the value of monitoring tools on what insights and actionable changes they deliver.
Why the Interest in Observability Now?
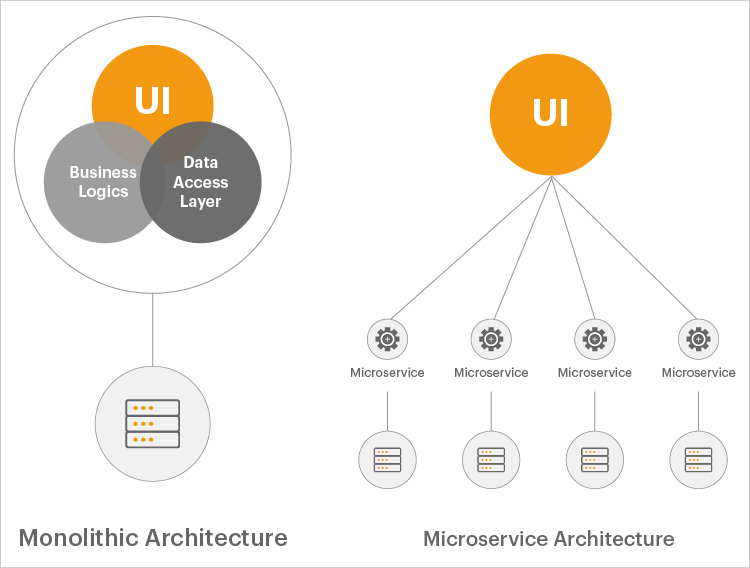
To improve efficiency, accelerate the pace of innovation and to reduced costs, organizations are moving from traditional, monolithic applications to modern, dynamic application architectures.
Traditional monolithic applications were usually written in one language and had static architectures. Deployment of the application was, by default, manual. Scaling of applications was enabled by increasing the sizing of servers they were deployed on. Software updates were also less frequent – typically, one or two releases or patches in a year.
Modern applications are very different from traditional applications. They use technologies like containers, Kubernetes and microservices, and the different microservices used by an application may involve different programming languages. Deployment of the application components is automated using Infrastructure as Code (IaC) and other orchestration mechanisms. Scaling of applications is mainly done horizontally, by adding new containers and instances, so application topologies have been dynamic as well. With DevOps approaches being used for application development, software updates are very frequent, with multiple teams being involved.
While modern application technologies provide advantages of agility, scalability and allow new capabilities to be introduced quickly, they add significant complexity. Furthermore, application components may be short lived and the application topology is dynamic. Given the significance of IT applications to businesses today, when failures happen, they cost the business hundreds of thousands of dollars in lost revenue. Hence, organizations are looking to be proactive and need ways to not only know when there is a problem, but they have to be able to quickly determine what caused the problem, so it can be rectified quickly. This is where observability comes in.
Benefits of Observability
Based on the above discussion, it is not difficult to determine the benefits of observability:
 By providing the analytics needed to analyze the performance of modern IT infrastructures and applications, observability makes troubleshooting easy and fast.
 User experience is enhanced, downtime is reduced and productivity is improved.
 Overall IT operations costs are reduced because less time is spent in finger-pointing across domains.
 Developer productivity is also improved as they get insights they need to determine how to tune their applications.
 IT operations can be made autonomous by adding automated control actions to common failure scenarios.
Must-Have Features for an Observability Solution
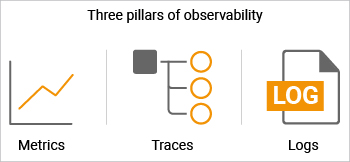 Metrics, logs, and traces are often known as “the three pillars of observability”. Metrics are numerical measurements with attributes that provide an indication of the health of one aspect of a system. In many scenarios, metric collection is intuitive – CPU, memory and disk utilization are obvious natural metrics associated with the health of a system. But there are usually several other key indicators that can highlight issues in the system. For example, a drain in OS handles can slow down a system to an extent where it has to be rebooted to make it accessible. Similar metrics exist at the every layer of the modern IT stack. Great care must be taken in figuring what metrics to collect on an on-going basis and how to analyze them. This is where domain expertise comes in. While most tools can capture obvious problems that occur, the best ones have the additional insights to detect and alert on the toughest of problems. Great care must also be taken to understand which of the thousands of metrics can be proactive indicators of problems in a system. For example, an OS handle leak rarely happens suddenly and by tracking the number of handles in use over time, it is possible to predict when a system is likely to become unresponsive.
Logs often contain granular details of an application’s request processing stages. Exceptions in logs can provide indicators of problems in an application. Monitoring errors and exceptions in logs is an integral part of an observability solution. Parsing of logs can also provide insights into application performance. In fact, there are insights available in logs that may not be obtained through APIs or from application databases. An observability solution must allow analysis of logs and even capturing of log data and correlating it with metric and trace data.
Tracing is a relatively new concept. Given the nature of modern applications, tracing must be done in a distributed manner. Data from multiple components is stitched together to produce a trace that shows the work flow of single request through a distributed system, end-to-end. Tracing helps break down end-to-end latency and attribute it to different tiers/components, helping to identify where the bottlenecks are. While traces may not tell you why a system is misbehaving, they can help narrow down which of the thousands of components supporting an application is at fault.
While collecting metrics, logs and traces is important, an observability solution is not just about collecting data. The collected data should be analyzed automatically, using AIOps capabilities. IT teams cannot be expected to sift through millions of metrics manually and repeatedly. Automated analysis using machine learning and AI technologies is an integral function of observability solutions. At the same time, they must also provide the visualizations – dashboards and reports – that allow IT teams to look for patterns in data sets, cross compare across them and draw meaningful conclusions.
“The primary distinction between observability and traditional APM is that observability-centric solutions support an exploratory, analytics-driven workflow that may bear resemblance to business intelligence, than IT operations.”
Gartner Magic Quadrant for Application Performance Monitoring and Observability, 2022
Full Stack Observability with eG Enterprise
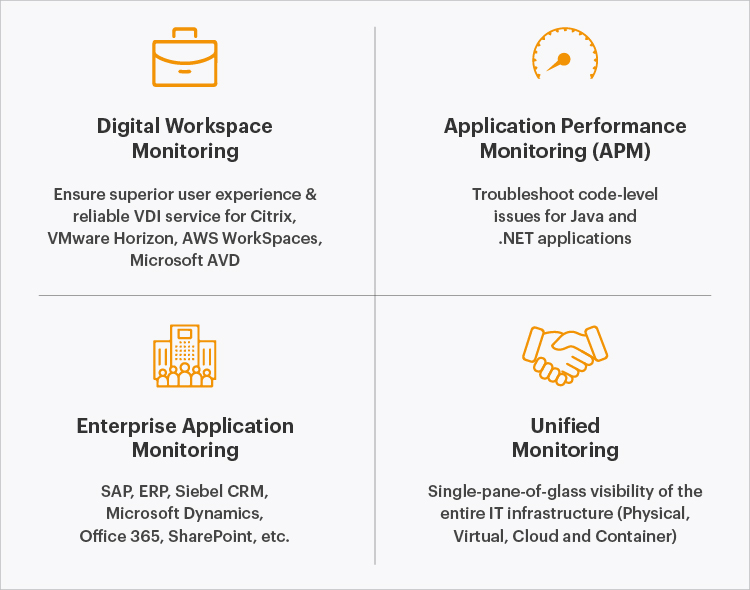
Full stack observability refers to the ability to provide insights into the performance and usage of every layer and every tier of the infrastructure, across application types. eG Enterprise is a single integrated observability solution that is built for cloud, hybrid and on-premises infrastructures. Its instrumentation covers a wide range of technologies – over 200 + common infrastructure and application components are supported out of the box. Built from ground up, eG Enterprise incorporates built-in domain expertise to address different use cases including digital workspaces (Citrix, VMware Horizon, Azure Virtual Desktop, etc.), web applications using languages like Java, Microsoft .NET, PHP, Node.js, etc., enterprise applications like SAP and other ERP applications, Siebel and other CRM technologies, and SaaS applications like Microsoft Office 365 and Zoom.
Patented data analytics built into the system facilitate automatic baselining, alerting and root-cause detection. An overview of the Machine Learning and Statistical Correlation Analysis built-into eG Enterprise are available in our in-depth eBook on AIOps (Artificial Intelligence for IT Operations). It is this set of capabilities that enables eG Enterprise offer great value to organizations across different verticals. See our case studies here.
eG Enterprise is an Observability solution for Modern IT. Monitor digital workspaces,
web applications, SaaS services, cloud and containers from a single pane of glass.
Learn More:
- An in-depth article explaining some of the history of observability and how observability is one aspect of control theory is available: Observability Challenges & Resources. An example of how Observability relates to containerized environments and Kubernetes and Docker is included.
- We did a webinar as part of a ‘shift-left’ series back in 2018 titled, “End-to-End Monitoring for ITSM and DevOps” and it had a section on monitoring, observability, and DevOps. In it, we described how monitoring and control loops are related.
- An excellent practical guide to implementing monitoring and observability strategies is available from Google, see: DevOps measurement: Monitoring and observability | DevOps capabilities | Google Cloud
- “What is observability? A beginner’s guide” is an excellent series of articles from TechTarget covering this subject.


 Aditya is a seasoned marketing specialist specializing in demand generation, who joined eG Innovations in 2022. With a robust background spanning nine years, he brings valuable expertise from his tenure in prominent product-based software companies, including unicorns.

