
Luckily, Python’s built-in logging module streamlines log management with customizable formats that enhance readability. With proper formatting, logs provide valuable context around events while meeting the structured needs of modern monitoring tools. This allows administrators to observe issues before users notice them, keeping services running optimally.
As an industry leader in monitoring solutions, eG Innovations understands how important optimized logging is for observability. In following Python logging best practices, teams can leverage a solution such as eG Enterprise to proactively detect anomalies, correlate events, and resolve problems before they impact end users.
What is Python Logging?
Python logging is the process of recording events and errors that occur in your Python application, providing a historical trail of activities and issues. Python’s robust logging module provides a standardized approach to recording diagnostics. Users simply import the module and define loggers to capture key moments in code execution. Event details are then serialized based on chosen formatting methods.
With Python logging, you can track errors, analyze application flow, and even monitor performance trends over time. Because logging is built directly into Python’s standard library, it avoids external dependencies that could complicate setups. It also offers flexibility through pre-configured log levels and the ability to customize the Python logger set format using specific format strings.
You can structure logs to make them easy to read and parse. A good logging format ensures that all necessary details—such as timestamps, log levels, and message content—are readily available when you need them. Python’s logging format allows tailoring the right balance of verbosity for debugging versus optimized production monitoring.
By default, logs print to the console, but handlers allow routing output to files, email alerts, or centralized collection servers. This simplifies log management at scale and enables remote monitoring without source code access.
Why is the Logging Format Important for Monitoring?
Log syntax matters greatly, especially for distributed systems where infrastructure may span cloud providers or data centers. Each entry can give you vital clues about what’s happening in your system at any given moment. If your logs are organized properly, solutions like eG Enterprise can parse and analyze them quickly, helping you pinpoint problems faster.
Unstructured logs make it difficult to identify root causes, especially during system outages or when performance issues creep up. Consistent formats guarantee logs remain readable across evolving codebases maintained by different teams over time. Proper formatting streamlines root cause analysis, too. Good centralized monitoring presents a unified view mapping application status, dependencies, resource usage, performance metrics, etc. Only through such can engineers pinpoint the exact culprit services requiring attention in case of issues.
Essentially, well-ordered logs ease observability into complex systems. By correlating timing, contexts,, and tracebacks in distributed traces, problems are resolved quickly before major outages upset users.
Key Components of a Python Logging Format
The most effective Python logging formats include a few key components that provide important context around each message. These include timestamps, log levels, tracebacks, message content, and custom fields. Monitoring solutions rely on this contextual data to understand the sequence of events and pinpoint potential problem areas.
Timestamps
Time is everything in logging. They tell you exactly when an event occurred, which is essential for tracing issues. Precise timestamps, often customized using the Python logging time format, help correlate logs from different services, making them invaluable in distributed systems.
For example, when a request travels through multiple microservices, having consistent timestamps across all services allows you to trace the journey of that request, identify where delays or failures occur, and correlate related events across systems.
When logging messages with the Python logging default format, you’ll see something like this:
2024-10-16 14:30:45,123 – INFO – User request received – Request ID: 12345
In this case, 2024-10-15 14:30:45,123 is the result of the default Python logging date format (YYYY-MM-DD HH:MM:SS,mmm) where mmm represents milliseconds. This allows you to trace exactly when each event happened and in what order when you have a series of such logs.
Log Levels
Different events require different levels of attention. Log levels classify the importance of messages. Python’s five logging levels help prioritize your response:
- DEBUG: Detailed information for diagnosing problems. Provides granular details that are useful during development but may be too verbose for production.
- INFO: Confirmation of an expected event, e.g. profile update completed for a user.
- WARNING: Indication that something unexpected happened. It highlights a non-critical issue that could become problematic like a missing dependency.
- ERROR: Serious problem that needs attention. An example is an unexpected database error.
- CRITICAL: The system is in a critical state and may stop functioning. Indicates an urgent incident impacting uptime e.g. when a server crashes due to low memory.
Proper log-level management ensures that developers and monitoring tools can focus on the most pressing issues.
Message Content
Your log messages should be clear and descriptive. Don’t just log “Error occurred.” Instead, provide context: “Database connection failed: Connection timeout.” Consider this Python logging format example:
logger.error(“Database connection failed after 3 retries: timeout=30s, host=db.example.com”)
This message includes:
- The specific event that occurred.
- Relevant context (retry count).
- Important parameters (timeout, host).
This way, you can quickly understand the issue without digging through lines of vague log entries. Including details like function names, input parameters, or system state will make your logs more informative and easier to act on.
Tracebacks for Exception Handling
When exceptions occur, tracebacks offer detailed information about where the error originated. Including tracebacks in log entries provides a complete picture of the failure, making diagnosing and fixing errors easier.
Custom Fields
Custom fields—such as user IDs, session data, or request IDs—provide additional context to logs, enabling more granular filtering and analysis. You can implement these using a Python logging custom formatter, which allows you to define exactly what information should appear in each log entry. Custom fields are particularly useful for large-scale applications where tracking specific users or requests is essential.
Advantages and Disadvantages of Python Logging
Understanding the benefits and inherent drawbacks of Python’s logging module is essential for optimizing its use in production environments, especially in backend systems that require effective monitoring and debugging.
Advantages of Python Logging
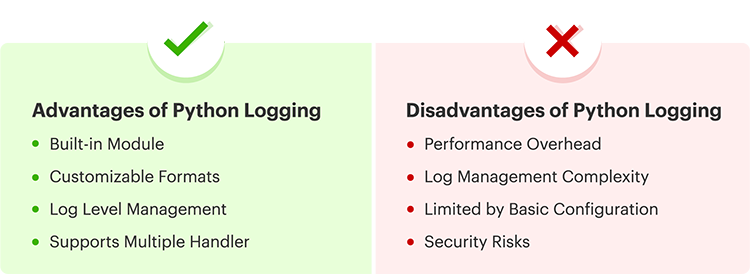
- Built-in Module: Python’s logging module is included in the standard library, making it simple to use without third-party dependencies. This speeds up development and integration into projects.
- Customizable Formats: The module allows developers to define custom logging formats, making it easy to include essential data like timestamps, log levels, and tracebacks. This flexibility ensures logs are informative and tailored to specific use cases.
- Log Level Management: As we saw, Python logging lets developers control log verbosity through different levels (DEBUG, INFO, WARNING, ERROR, CRITICAL), meaning teams can maintain detailed logs.
- Supports Multiple Handlers: Python supports routing logs to various outputs such as files, the console, or remote servers through multiple handlers, enabling centralized log management and easy integration with monitoring tools.
Disadvantages of Python Logging
- Performance Overhead: Excessive logging, particularly at DEBUG or INFO levels, can significantly impact application performance. Each log operation requires CPU cycles and I/O operations that can accumulate to create noticeable slowdowns in high-throughput systems.
- Log Management Complexity: Large-scale applications can generate an overwhelming volume of logs, making it challenging to manage and analyze them without external tools or log rotation strategies.
- Limited by Basic Configuration: While Python logging is flexible, the basic configuration may not meet complex requirements. Additional libraries or tools may be required for advanced logging needs, such as structured logging or sophisticated formats.
- Security Risks: If developers are not careful, sensitive data can be logged, violating compliance laws if exposed and posing risk, especially for industries like healthcare.
Understanding these advantages and disadvantages helps developers optimize application logging practices, ensuring effective monitoring without sacrificing performance or security.
Types of Python Logging Format Options
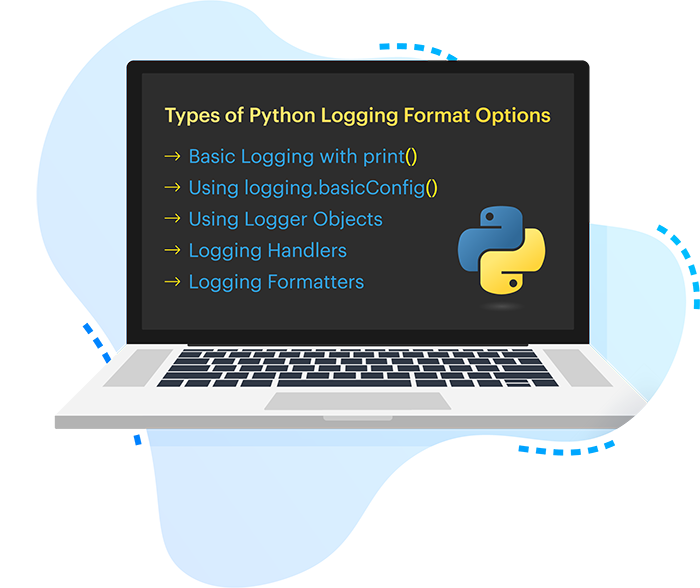
Python’s logging module offers different logging approaches, each suited for specific use cases, from basic to more advanced setups. Choosing the right logging method is critical for ensuring that logs capture relevant information without sacrificing application performance.
Basic Logging with print()
Many developers start with print() statements for debugging. While effective for simple output, print() lacks the flexibility, scalability, and control needed for production-grade logging, such as the ability to write logs to files, manage log levels, or centralize logs.
For example, if you need to write logs to a file or separate error logs from informational ones, print() falls short. This method is best reserved for short-term debugging rather than long-term monitoring or production environments.
Using logging.basicConfig()
Python’s logging.basicConfig() is a quick and easy way to configure logging with minimal setup. It lets you define log levels, output formats, and destinations of logs (e.g., console or file). For example, you can set up a logger with a timestamp and log level in just one line of code:
import logging
logging.basicConfig(format=’%(asctime)s – %(levelname)s – %(message)s’, level=logging.INFO)
This setup ensures logs are well-structured without requiring advanced configuration.
Using Logger Objects
For more control, Python’s Logger objects let you create multiple loggers with different settings for various parts of your application. You can define custom log levels, formats, and handlers for each logger, making it easier to organize logs in complex applications.
For instance, you might have one logger for tracking user activity and another for tracking system errors, each writing to different files:
logger1 = logging.getLogger(‘user_activity’)
logger2 = logging.getLogger(‘system_errors’)
Logger objects are the Swiss Army knife of Python logging, offering granular control and flexibility that helps tailor your logging strategy to specific needs.
Logging Handlers
Handlers determine where logs are sent, allowing you to direct log messages to different outputs like files, the console, remote servers, or even email. Common handlers include StreamHandler for console output, FileHandler for writing logs to a file, and SMTPHandler for sending logs via email.
For example, you could use both FileHandler and StreamHandler to log messages to a file and display them on the console simultaneously. This approach provides greater flexibility in managing and centralizing logs.
Logging Formatters
Python logging formatters define the layout of your log messages, including fields like timestamps, log levels, and messages. Using the Formatter class, you can create a standardized Python logging format that’s easier to parse and analyze. Consider a formatter like this:
import logging
formatter = logging.Formatter(
fmt=’%(asctime)s | %(name)s | %(levelname)s | %(message)s’,
datefmt=’%Y-%m-%d %H:%M:%S’
)
handler = logging.StreamHandler()
handler.setFormatter(formatter)
logger = logging.getLogger(‘myapp’)
logger.addHandler(handler)
logger.warning(“High memory usage detected: 85%”)
The above produces logs with a clear structure that monitoring tools can more easily understand and ingest.
# Output: 2024-10-17 14:30:45 | myapp | WARNING | High memory usage detected: 85%
Understanding these logging options helps you build a robust logging strategy that grows with your application. Choose the right combination of these tools to ensure you have the visibility you need when issues arise.
How eG Innovations Enhances Python Logging Best Practices
While Python provides strong logging capabilities, observability challenges remain for complex distributed systems. Here’s where solutions like eG Enterprise prove invaluable by seamlessly integrating with Python applications. Our monitoring solutions take your Python logging to the next level by automatically parsing and categorizing logs, providing real-time alerts based on log patterns, and correlating logs with performance metrics.
Such details empower your monitoring dashboards, allowing you to visualize end-to-end request flows with insights into slow transactions, errors, or memory leaks impacting users. Explore our monitoring solutions to see how we can help you maintain peak performance and quickly resolve issues before they impact your users.
Want to experience the difference yourself right now? Book your free trial today and discover how eG Innovations can revolutionize your Python application monitoring.
eG Enterprise is an Observability solution for Modern IT. Monitor digital workspaces,
web applications, SaaS services, cloud and containers from a single pane of glass.
 Krish is a seasoned Solutions Architect with over 15 years of experience in designing and implementing innovative technology solutions. Throughout his career, he has remained committed to solving complex business challenges by integrating process and technology effectively.
Specializing in Performance Management Technologies, Krish has extensive expertise in architecting and deploying solutions for Virtual Infrastructure, including Virtual Servers and Virtual Desktops from VMware and Citrix. With a deep understanding of enterprise needs, he collaborates with customers to develop tailored solutions that enhance efficiency, scalability, and performance.
Krish is a seasoned Solutions Architect with over 15 years of experience in designing and implementing innovative technology solutions. Throughout his career, he has remained committed to solving complex business challenges by integrating process and technology effectively.
Specializing in Performance Management Technologies, Krish has extensive expertise in architecting and deploying solutions for Virtual Infrastructure, including Virtual Servers and Virtual Desktops from VMware and Citrix. With a deep understanding of enterprise needs, he collaborates with customers to develop tailored solutions that enhance efficiency, scalability, and performance.