Synthetic Monitoring for Microsoft Azure DaaS
We recently announced a FREE ready-to-go standalone SaaS logon simulator tool for monitoring Microsoft Azure DaaS service levels. This free tool is available here. This joins our fully featured logon simulator available for use on-premises, as SaaS or in the cloud within our synthetic monitoring suite. A logon simulator, whilst a useful tool, should be used in conjunction with other synthetic and real user monitoring tools for a truly proactive IT strategy designed to prevent real users encountering issues and raising support tickets.
In this article I’ll cover how you can go beyond logon simulators with Client Session Simulation to test things logon simulation simply can’t touch:
- To test for the success of and benchmark profile attach times for FSLogix and whether any supporting storage is available and performant.
- To test if key applications such as SAP or Teams and the underlying Azure infrastructure supporting them are working and performant.
- How you can automatically test in advance is there is a Teams issue preventing users making calls.
- Whether a SAP database is slow and affecting users once they try to use the app in the AVD workspace they have successfully logged onto.
How does Synthetic Monitoring work?
Synthetic monitoring works from an external perspective. Hence, no agents need to be installed on the servers hosting your key applications. You will need to dedicate a VM or desktop where the synthetic monitoring will be executed from. Synthetic monitoring using protocol emulation and logon simulation does not require any recording. With full session simulation, you can simulate multiple user interactions using client applications (e.g., user logging in, filling a form, going through an eCommerce checkout process, etc.). This process involves a recording step followed by periodic playback of the recorded script to measure application availability and responsiveness.
Go Beyond Logon Simulation with Full Session Simulation
For many users of Microsoft AVD, and the other platforms we support, logon simulators, whilst a useful tool, do not go far enough. Logon simulation only measures the logon time. SLAs (Service Level Agreements) that are offered to customers usually do not stop with just logon times. Once a user logs on to their desktop, they may launch applications and perform actions within the application. A synthetic monitoring strategy needs to go beyond logon because if a user can logon but cannot use the actual applications they need for their job because they are unavailable, or user experience and performance is substandard – a successful logon is a meaningless and inadequate measure of a functional IT service.
For many office workers who have moved to hybrid work patterns or are working from home, the launch of critical communication platforms and multi-application workspaces such as Microsoft Teams, Office and SharePoint or Google Workspace (formerly G Suite) have become critical and potential bottlenecks when starting work each day.
Full Session Simulation (sometimes known as Client Session Simulation) involves robot users logging on and actually accessing an application or a series of applications. Involving steps such as opening a customer record in Salesforce, updating it and saving it, creating a new customer and so on. In doing so the underlying databases, networking and storage, along with any third-party services are exercised and timings measured. This means not only failures, but slowdowns and slow actions are detected, and alerts raised, so that issues can be resolved proactively before users are affected, avoiding IT help desk tickets.
Full session simulation can also detect issues not detected by logon simulation alone, such as issues with FSLogix profiles and their associated VHD(X) disks that may impact the end user’s access to their application and impact user experience.
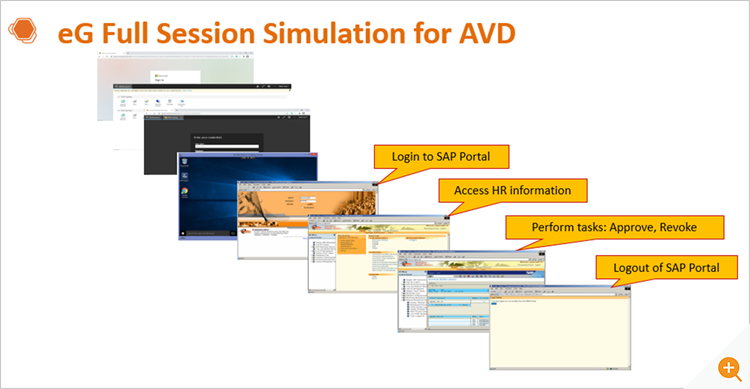
SLAs should deal with time taken for performing actions within the application. This is where full session simulation comes in. The sequence of screens below indicates the clicks and actions performed by a user in their VDI session. The first three steps are the AVD logon steps. Beyond these, the user may launch a browser, connect to an SAP portal, access HR information, perform different actions and log out.
Full session simulation is technology that is ideal for simulating multi-step transactions within any type of application – thin client or thick client. This uses a simulation engine that works based on optical character recognition (OCR) technology. eG Enterprise emulates a real user accessing an application, and records and plays back the scenario 24×7 as scheduled:
eG Enterprise AVD Simulation Features
- Agentless
- Multi-location
- Multi-logon, multi-application
- Response time breakdown
- SLA reports
- Screenshots showing failures
- Alerts in advance
- It uses the same thin client (e.g., AVD client) or thick client (e.g., SAP GUI) that real users employ, and performs a sequence of mouse clicks, data entry operations, and keystrokes based on pre-recorded scripts.
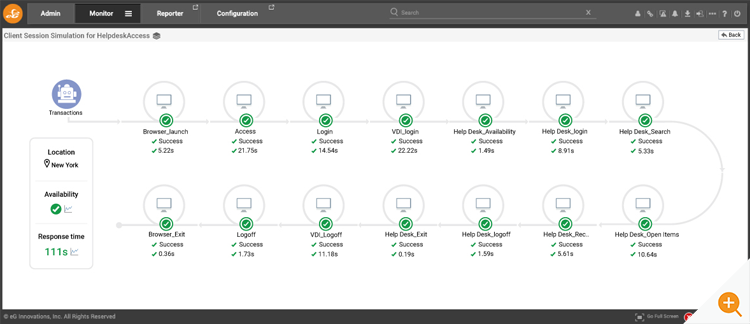
- It observes the responses at each transaction step, matches the results with expected patterns, and baselines, and reports the performance metrics on an intuitive web console.
- Based on the results, IT teams can quickly determine which transaction in a session is slow or not working.
- Screenshots of failed steps are automatically captured to assist IT staff resolve issues.
Other Synthetic Tools for AVD Service Level Monitoring
In addition to Logon Simulation and Full Session Simulation, the eG Enterprise portfolio also includes other synthetic monitoring tools useful for AVD administrators:
- Logon Simulators: Available for all common digital workspace technologies including Citrix, VMware, Amazon WorkSpaces as well as Microsoft AVD. Our FREE logon simulator for Microsoft AVD is available, here: Free AVD logon simulator for Azure Virtual Desktop | eG Innovations.
- A Protocol Simulation Feature. This is the simplest simulation approach. It simulates requests to target systems and applications by simulating requests using different common protocols (HTTP, SMTP, FTP, SQL, ICA, etc.). Depending on the target, protocol simulation can be used to test individual tiers of an infrastructure or to check end-to-end performance. By design, protocol simulation works for single-step transactions only. See: Synthetic Monitoring & Synthetic Transaction Monitoring Tools (eginnovations.com)
- A Web Application Simulator – purpose built for those delivering web services and SaaS to deliver their own SLA commitments or for those leveraging a SaaS and third-party applications to hold vendors accountable to their contracted SLAs. See Synthetic Web Application Monitoring | eG Innovations and How does the Web App Simulator Work? (eginnovations.com)
Cost-effective Licensing and Flexible Deployment Options
The synthetic testing tools with eG Enterprise are licensed per installation machine. Once installed you can run unlimited tests on your applications infrastructure without racking up per test PAYG type costs.
eG Enterprise and the synthetic monitoring features can be deployed on-premises, on a public or private cloud of choice or can be consumed as a ready-to-go SaaS service. We appreciate some customers need on-premises options and are committed to feature parity with our SaaS options for those that do.
Synthetic Monitoring Alone Is Not Proactive Monitoring
Synthetic monitoring tools are not truly proactive tools, it’s worth understanding what true proactive testing is as it highlights the limits of Synthetic testing (see What is Proactive Monitoring and Why it is Important). Whilst robot users can discover issues before real users encounter them, you are still discovering issues that have already occurred via a subset of user workflows, rather than discovering warnings signs in complex (possibly non-intuitive) real user workflows and taking pre-emptive rectification steps.
Synthetic Monitoring should ideally be used in conjunction with Real User Monitoring (RUM) both to tune the design of synthetic monitoring tests but also to capture vital diagnostic data by process. eG Enterprise also covers performance monitoring of real users and applications using Microsoft AVD, including that vital RUM user data …. but that’s one for another blog!
eG Enterprise is an Observability solution for Modern IT. Monitor digital workspaces,
web applications, SaaS services, cloud and containers from a single pane of glass.
Read More:
- Why synthetic monitoring should be complemented with Real User Monitoring: Synthetic Monitoring vs Real User Monitoring – RUM
- What is Synthetic Monitoring – How to Make it Work
- If you are encountering slow AVD logons or failed AVD logons, you might like to read our recent guide for troubleshooting AVD logons: Troubleshoot Slow Azure Virtual Desktop Logons (eginnovations.com).
- There’s a decent community deep-dive on factors which cause slow VDI launch times available from James Rankin for those that want to delve further, although Citrix focused it covers many factors relevant to digital workspaces in general.
- Learn about how to monitor your entire Azure landscape, see: Azure Monitoring
- Azure AVD (Azure Virtual Desktop) Monitoring
- Logon simulation for Citrix/VDI
- Full session simulation for any application (thick client, Citrix/VDI, web applications, etc.)
- Real user monitoring for web applications
- Real user monitoring for enterprise applications (SAP, Confluence, SharePoint, etc.)
- Real user experience monitoring for Citrix/VDI
- You can read more on both Real and Synthetic Monitoring options for eG for AWS WorkSpaces: AWS WorkSpaces Monitoring (eginnovations.com) and Synthetic Monitoring of Amazon Workspaces | eG Innovations
- For more on eG Enterprise’s support for Amazon Cloud Environments and services, including EC2 monitoring see: AWS Monitoring Solutions & Performance Tools | eG Innovations


 Rachel has worked as developer, product manager and marketing manager at Cloud, EUC, application and hardware vendors such as Citrix, IBM, NVIDIA and Siemens PLM. Rachel now works on technical content and engineering and partner liaison for eG Enterprise


