What are the three pillars of Observability?
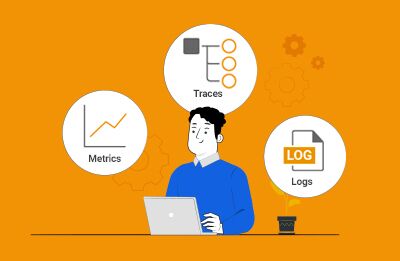
Observability in IT assesses the state of an application through metrics, logs, and traces (MELT). Metrics provide performance data, logs offer event records, and traces follow request paths. While monitoring identifies issues, observability explains why they occur, enhancing system reliability and efficiency.
Observability involves gathering different types of signals and data about the components within a system, to establish the “Why?” rather than just the “What went wrong?”. Whereas Monitoring tells you when something is wrong, Observability tells you why something is wrong. You can read more on the basic differences between monitoring and observability, here: Observability vs Monitoring: What is the Difference?
The traditional “Three Pillars of Observability” are usually defined to be Metrics, Logs and Traces.
Events – The building blocks of Observability
The “Three Pillars of Observability” as defined as Metrics, Logs and Traces, all rely on the concept of “Events”. Indeed, in some definitions such as MELT, events are considered on a par with the traditional pillars.
Events are essentially the basic building blocks of monitoring and telemetry. An occurrence that can be defined, something discrete and unique that happened. An event will have happened at a specific time and have some quantitative measure to determine that it has occurred.
Often events will have some associated context particularly those associated with user interaction, actions and expectation. For example – a user pressing the “Pay Now” button on an online eCommerce site, the “event” of pressing the pay button is expected by the user to deliver a payment page or form within a reasonable period of time (probably < 2 seconds).
An observability solution starts by tracking events that signal individual actions occurring at a moment in time. Within the context of a monitoring tool the system administrator or IT Operations team will want to know about “Significant Events” i.e., events indicating an IT issue or an event that is indicative that a problem may be imminent and could be averted, this usually means:
- Automated alerting to let SREs or Operations know the event has occurred
- Diagnostic tools or automated root-cause analysis to determine “Why” the event has occurred
A server disk reaching 99% capacity would be an event many admins would consider significant, but beyond that an administrator would need information on the applications and users of the disk to understand why the system is in the current state.
Metrics
 Metrics are numerical measurements with attributes that provide an indication of the health of one aspect of a system. In many scenarios, metric collection is intuitive – CPU, memory and disk utilization are obvious natural metrics associated with the health of a system. But there are usually several other key indicators that can highlight issues in the system. For example, a drain in OS handles can slow down a system to an extent where it has to be rebooted to make it accessible. Similar metrics exist in every layer of the modern IT stack.
Great care must be taken in figuring out which metrics to collect on an on-going basis and how to analyze them. This is where domain expertise comes in. While most tools can capture obvious problems that occur, the best ones have the additional insights to detect and alert on the toughest of problems. Great care must also be taken to understand which of the thousands of metrics can be proactive indicators of problems in a system. For example, an OS handle leak rarely happens suddenly and by tracking the number of handles in use over time, it is possible to predict when a system is likely to become unresponsive.
Advantages of metrics
- Highly quantitative and often intuitive to associate with alerting thresholds
- Lightweight and cheap to store and retrieve
- Metrics are very good at tracking trends over time and understanding trends and how systems or services are changing
- Provide real time data on the state of components
- Metric transfer and storage generally has a constant overhead. Unlike logs, the cost of metrics does not increase in step with user traffic or system activity resulting in surges of data
Problems with metrics
- Typically, metrics are very good for monitoring and telling you “that” you have an issue – e.g., a server running at 100% of CPU is a problem; but metrics alone provide little insight into the “why” there is an issue necessary for remediation – e.g., which applications are consuming all of the CPU capacity.
- Metrics alone lack the context of individual customer interactions or the events that have triggered the system’s behavior.
- Metrics may be subject to data loss if the collection or storage system fails. This can result in missing data and make it difficult to get a complete picture of system behavior.
- Metrics are typically collected at a fixed interval, which means that they may miss important details or fluctuations that occur between collection points. This can make it difficult to detect and respond to issues in real-time.
- Excessive sampling and metric collection can impact system performance and lead to unnecessary storage and data cost particularly in PAYG public cloud.
Logs
 Logs often contain granular details of an application’s request processing stages. Exceptions in logs can provide indicators of problems in an application. Monitoring errors and exceptions in logs is an integral part of an observability solution. Parsing logs can also provide insights into application performance.
In fact, there are insights available in logs that may not be obtained through APIs (Application Programming Interfaces) or from application databases. Application ISVs (Independent Software Vendors) often do not provide alternative mechanisms to access the data they expose via logs. An observability solution must allow analysis of logs and even capturing of log data and correlating it with metric and trace data.
Advantages of logs
- Logs are an extremely easy format to generate – usually a timestamp plus a payload (often plain text). Can require no explicit integration by application developers other than adding a print statement.
- Most platforms provide a standardized well-defined framework and mechanism for logging e.g., Windows Event Logs.
- Often plain text and human readable.
- Can offer incredibly granular information into individual applications or components allowing retrospective replaying of support incidents.
Problems with logs
- Logs can generate large volumes of data, on PAYG (Pay As You Go) cloud this can incur significant costs.
- Excessive logging can also impact application performance particularly when the logging isn’t asynchronous and can block functional operations.
- Users often use logs retrospectively rather than proactively, using tools to manually parse information after an incident has occurred and users already impacted.
- Persistence can be a problem especially in modern architectures using auto-scaling, microservices, VMs (Virtual Machines) or containers. Logs within containers can be lost when containers are destroyed or fail.
Traces
 Tracing is a relatively new concept. Given the nature of modern applications, tracing must be done in a distributed manner. Data from multiple components is stitched together to produce a trace that shows the workflow of single request through a distributed system, end-to-end.
Tracing helps break down end-to-end latency and attribute it to different tiers/components, helping to identify where the bottlenecks are. While traces may not tell you why a system is misbehaving, they can help narrow down which of the thousands of components supporting an application is at fault.
Advantages of traces
- If you know there is problem with a service, traces are perfect for identifying the component or step in which the problem is occurring
- Traces can provide end-to-end visibility into the flow of requests and responses across multiple services, allowing you to understand the behavior of the entire system
- Traces are very good at identifying performance bottlenecks that could affect the overall end-user experience and where optimizations would yield most impact
- Traces can be used to debug issues in a distributed system by providing a detailed record of the flow of requests and responses. This can help identify the root cause of issues and speed up the debugging process
- Traces can provide contextual information about the behavior of a system, such as the specific request being processed or the user making the request. This can help you understand the root cause of issues and make informed decisions about how to address them
Limitations of traces
- Traces do not tell you about trends or patterns over time without further aggregation and processing
- Complex distributed systems are often now designed for failover so traces for a service may take different paths, numerous forks may be possible and as such it can be extremely hard to compare and aggregate traces
- Traces do not tell you why a particular span (step) of the trace is failing or slow, only that it is. Metrics or logs are needed to determine that a problem such as slow network traffic is caused by a faulty network card or insufficient bandwidth
- Tracing can add significant overhead to a system, particularly when tracing is performed at a high level of granularity. This can impact system performance and increase latency.
Profiles – Is profiling the missing pillar of Observability?
Profiles are a complementary technique to the three pillars of observability – logging, metrics, and tracing. While not officially considered as a “fourth pillar,” profiling can provide valuable insights into the performance and behavior of a system.
Profiling involves collecting detailed information about the state of individual code that is executed at a given moment in time. An example is the current state of Java threads which could be one of RUNNING or a WAIT state. This information can be used to identify performance bottlenecks and resource usage patterns that may not be visible through other observability techniques. Profiles can be considered as an x-ray into the internals of a single component.
Profiles can be particularly useful for identifying issues that occur at a very low level, such as individual functions or code blocks. By collecting detailed information about how an application is behaving in real-time, profiling can help developers optimize code and improve overall system performance. Profiling can allow development teams to understand which code paths are taken and which blocks of code are critical, unused code paths can be examined and deprecated, whilst critical code paths can be prioritized and scrutinized.
Overall, while not officially considered one of the three pillars of observability, profiling is a valuable tool for gaining insights into the behavior and performance of a system. When used in conjunction with logging, metrics, and tracing, profiling can help provide a comprehensive picture of system behavior and facilitate effective troubleshooting and optimization.
Profiling has recently attracted renewed interest due to the inclusion of Continuous Profiling on the OpenTelemetry Roadmap in 2022, as well as the provision of profiling capabilities within projects such as eBPF for the Linux Kernel which has made developing profilers easier.
Limitations of the three pillars of Observability – metrics, logs and traces
One of the greatest challenges for observability in modern IT systems is in tracking change configuration. In systems where the infrastructure topology and configuration are continually changing, correlating and aggregating data becomes extremely challenging.
Modern technologies such as microservices, virtualization, containers, autoscaling and orchestration mean that VMs, containers and resources can be spun-up, destroyed and re-sized. These resources and components have very ephemeral lifespans. Software updates and patches are frequent and often automated which means that software and the system has changed. Any such change has the potential to be the root cause of an IT problem and the trigger that caused the issue.
Enterprise-ready observability tools such as eG Enterprise provide configuration auto-discovery and tracking to plug the gaps that traditional monitoring tools have in this area.
How the three pillars of Observability work together?
Logs, metrics and traces each provide a valuable, but limited, level of visibility into applications and infrastructures. However, when you combine these three sources, it is possible to get a relatively complete view of a system. How complete that view of the system is largely dictated by the capabilities of the monitoring tool’s features to collect, deduplicate, correlate and aggregate the different data sources.
In the next section, we’ll look at how eG Enterprise goes beyond the traditional three pillars to provide full-stack visibility into distributed applications.
How eG Innovations can help with Observability and goes beyond the traditional three pillar definition?
eG Enterprise is a full-stack observability solution that provides visibility into the performance of software systems and IT infrastructures. Whilst each of the three pillars has its own limitations, eG Enterprise offers several features that can help overcome some of these limitations:
- Metrics: Metrics provide a high-level view of the performance of a system, but they can be limited in their ability to provide insights into the root cause of issues. eG Enterprise offers intelligent baselining and anomaly detection, which can help identify abnormal behavior and surface relevant metrics to troubleshoot issues.
- Logs: Logs provide detailed information about the behavior of a system, but they can be difficult to sift through and analyze, especially at scale. eG Enterprise offers log analytics capabilities including live monitoring of logs that can help automatically parse and watch logs, ensuring IT teams are alerted to potential issues proactively.
- Traces: Traces provide a detailed view of the interactions between different components of a system, but they can be limited in their ability to provide context for the behavior of the system as a whole. eG Enterprise offers distributed tracing capabilities, which can help trace requests across different services and provide end-to-end visibility into the performance of a system.
-
Events: We talked about how events signal discrete timestamped actions that impact your system. Although it is intuitive to think about user generated actions such as clicks or transactions or errors, events could also be internal system related. Examples include:
- Alerts: Static and dynamic anomalies or outliers
- Deployments or Configuration changes: A hotfix or software upgrade means you are literally measuring a different thing
eG Enterprise provides specialized dashboards and reports that allow you to get deep visibility into these wide variety of events that span your system.
- Profiling: eG Enterprise performs deep profiling of code that is executed on the JVM or CLR. eG Enterprise makes it easy to identify blocked and deadlocked threads, and the exact object/line of code causing these issues. You can get the exact thread name and its stack trace that is causing high CPU usage in the JVM or CLR.
- User Experience: With synthetic and real-user monitoring capabilities, an observability solution can provide insights into user experience data, allowing you to identify issues proactively and improve user experiences with quick feedback.
- Configuration and Change Tracking: eG Enterprise discovers and tracks the details of changes whether that’s how Citrix registry keys have changed, new Java application servers being spun up, hotfixes / software version changes and so on.
In addition to these features, eG Enterprise also offers AIOps powered analytics and automated root cause analysis, which can help quickly identify and resolve issues. By combining these features with the three pillars of observability, eG Enterprise can help overcome some of the limitations of traditional observability approaches and provide deeper insights into the behavior of systems.
eG Enterprise provides an easy to use, no code, GUI single console providing visibility to the whole organization from IT staff, to business managers, to L1 / L2 help desk operators.
eG Innovations long history in observability is covered in my colleague John Worthington’s article, Kubernetes Observability Challenges & Resources | eG Innovations, where John discusses the theory and approaches as well as new challenges introduced by modern scaling and autoscaling technologies such as Kubernetes orchestration.
Other perspectives on Observability and the three pillars
There are plenty of other great articles explaining the limitations, nuances, and caveats of the three pillars of observability. Some other I’d recommend exploring if you want to explore beyond this article are:
eG Enterprise is an Observability solution for Modern IT. Monitor digital workspaces,
web applications, SaaS services, cloud and containers from a single pane of glass.
- The Three Pillars of Observability – Distributed Systems Observability [Book] (oreilly.com) – this chapter covers some practical challenges and implementations and is particularly insightful on logging – covering reliability and the RELP protocol, different log formats (binary / structured / JSON / text and so on) and modern log streaming methodologies (Kafka / KSQL).
- A great succinct article from Stephen Townshend, Developer Advocate (SRE) at SquaredUp – Metrics vs. Logs vs. Traces (vs. Profiles) – SquaredUp. Includes nice human-readable analogies comprehendible to non-technical staff and a nice overview of Profiles (Are Profiles the missing fourth pillar?).
- A fairly mainstream but well-written overview from TechTarget: The 3 pillars of observability: Logs, metrics and traces | TechTarget
- Read a whitepaper on how eG Enterprise v7.2 delivers observability, here: Observability for Modern IT with eG Enterprise v7.2 | White Paper (eginnovations.com).
- Code-level profiling for Java code: https://www.eginnovations.com/supported-technologies/java-performance-monitoring
- Cindy Sriharan’s blogs on “What is Observability” are considered a must read by many and predate a lot of current marketing around the terminology, see: Monitoring and Observability. During lunch with a few friends in late… | by Cindy Sridharan | Medium
eG Enterprise is an Observability solution for Modern IT. Monitor digital workspaces,
web applications, SaaS services, cloud and containers from a single pane of glass.


