A Typical Production Scenario: How Do You Handle Complaints of Slow Java Applications?
It is 2 am in the morning and you get woken up by a phone call from the helpdesk team. The helpdesk is receiving a flood of calls from application users complaining about slow Java applications that are business impacting. Users are complaining that the browser keeps spinning and eventually all they see is a ‘white page’.
Still somewhat heavy-eyed, you go through the ‘standard operating procedure’. You notice that no TCP traffic is flowing to or from the app server cluster. The application logs aren’t moving either.
You are wondering what could be wrong when the VP of IT Operations, pings you over Instant Messenger asking you to join a war room conference call. You will be asked to provide answers and pinpoint the root cause of why your Java applications are slow – fast.
This is a classic case of application hang due to a deadlock of threads in the Java Virtual Machine (JVM). This blog will explain what Java application deadlocks are, why they happen and summarize the repercussions of deadlocks and provide options to diagnose and troubleshoot them to ensure that you don’t have slow Java applications. Read on.
What are Java Application Deadlocks?
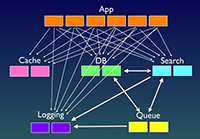
A deadlock occurs when two or more threads in the JVM form a cyclic dependency with each other. In this illustration ‘thread 2’ is in a wait state, waiting on Resource A owned by ‘thread 1’, while ‘thread 1’ is in a wait state, waiting on Resource B owned by ‘thread 2’. In such a condition, these two threads are ‘hanging’ indefinitely without making any further progress. This results in an “application hang” where the application process is running but the system is not responding to user requests.
“The JVM is not nearly as helpful in resolving deadlocks as database servers are. When a set of Java threads deadlock, that’s the end of the game. Depending on what those threads do, the application may stall completely.”
Brian Göetz, Author of Java Concurrency in Practice
Main Consequences of Java Application Deadlocks
1. Poor User Experience
When a deadlock happens, the application may stall or become very slow. Typical symptoms could be “white pages” in web applications while the browser continues to spin eventually resulting in a timeout. Often, users might attempt to retry their request by clicking refresh or resubmitting a form, which compounds the Java performance problem further.
2. System Undergoes Exponential Degradation
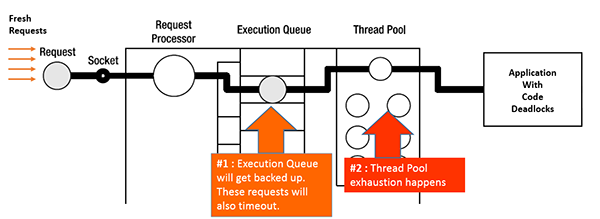
When threads go into a deadlock situation, they take longer to respond. In the intervening period, a fresh set of requests may arrive into the system.

When deadlocks manifest in application servers, fresh requests will get backed up in the ‘execution queue’. The application server’s thread pool will hit the max utilization, thereby denying service to new requests. This causes further exponential degradation of performance.
3. Cascading Impact on the Entire Application Server Cluster
In multi-tier applications, web servers (such as Apache or IBM HTTP Server) receive requests and forward it to application servers (such as WebLogic, WebSphere or JBoss) via a ‘plug-in’. If the plug-in detects that the application server is unhealthy, it will “fail-over” to another healthy application server which will accept heavier loads than usual thus resulting in further slowness. This may cause a cascading slowdown effect on the entire cluster.
Challenges with Troubleshooting Deadlocks in a Clustered, Multi-tier Environment
Application support teams are usually caught off-guard when faced with deadlocks in production environments. There are there main scenarios when it becomes difficult to detect deadlocks.
- Deadlocks typically do not exhibit typical symptoms such as a spike in CPU or Memory. This makes it hard to track and diagnose deadlocks based on basic operating system metrics.
- Deadlocks may not show up until the application is moved to a clustered environment. Single application server environments may not manifest latent defects in the code.
- Deadlocks usually manifest in the worst possible time – heavy production load conditions. They may not show up in low or moderate load conditions. They are also difficult to replicate in a testing environment because of the same load condition reasons.
So, How to Diagnose and Troubleshoot Java Application Deadlocks?
There are various options available to troubleshoot deadlock situations that could result in slow Java applications.
1. The naïve way: Kill the process and cross your fingers
You could kill the application server process and hope that when the application server starts again, the problem will go away. However, restarting the application server is a temporary fix that will not resolve the root-cause. Deadlocks could get triggered again when the application server comes back up.
2. The laborious way: Take thread dumps in your cluster of JVMs
You could take thread dumps. To trigger a thread dump, send a SIGQUIT signal to the JVM. (On UNIX, that would be a “kill -3” command and on Windows, that would be a “Ctrl-Break” in the console).
Typically, you would need to capture a series of thread dumps (example: 6 thread dumps spaced 20 seconds apart) to infer any thread patterns – just a static thread dump snapshot may not suffice.
If you are running the application server as a Windows service (which is usually the case), it is a little more complicated. If you are running the Hotspot JVM, you could use the jps utility to find the process ID of the JVM and then use the jstack utility to take thread dumps. You can also use the jconsole utility to connect to the JVM process in question.
Then, you would have to forward the thread dumps to the development team and wait for them to analyze and get back. Depending on the size of the cluster, there would be multiple files to trawl through and this might entail significant time.
This is not an optimal situation you want to be at 2 am in the morning when the business team from another country is waiting on a quick resolution.
Manual Processes to troubleshoot Java application deadlocks can be time consuming

The manual approach of taking thread dumps assumes that you know which JVM(s) is (are) suffering from deadlocks. Chances are that the application is hosted in a high-availability, clustered Application Server farm with tens (if not hundreds) of servers.
If only a subset of JVMs are undergoing the deadlock problem, you may not be in a position to precisely know which JVM is seeing thread contention or deadlocks. You would have to resort to taking thread dumps across all of your JVMs.
This becomes a trial-and-error approach which is both laborious and time-consuming. While this approach may be viable for a development or staging environment, it is not viable for a business-critical production environment where ‘Mean-Time-To-Repair’ (MTTR) is key.
3. The smart way: Leverage an APM solution for monitoring JVM threads
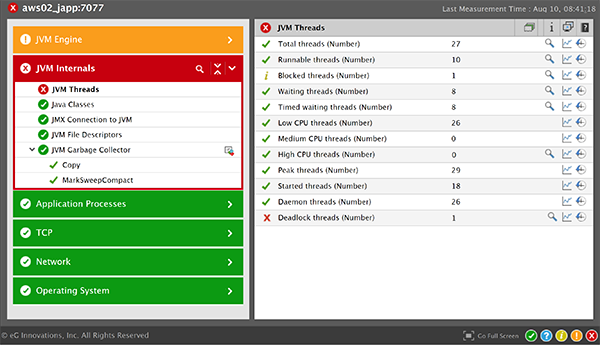
There are many application performance monitoring (APM) tools that provide code-level and JVM-level visibility to isolate thread deadlocks. eG Enterprise APM provides deep diagnostics of JVM threads and automatically detects deadlocks. Using distributed transaction profiling, developers can also gain method-level visibility of the Java code to isolate any bugs/defects/inefficiencies that may be causing issues. Automated monitoring simplifies troubleshooting and reduces manual analysis and prognosis.

eG Enterprise is an Observability solution for Modern IT. Monitor digital workspaces,
web applications, SaaS services, cloud and containers from a single pane of glass.


