Questions and FAQs about Web Application Performance Management
One of the best parts of our job is enabling you to become the best #ITPerformanceHero that you can be. But behind the scenes, eG Innovations is filled with talented team members who wear their own IT Hero capes. We want to take some time to introduce you to some of the people who make eG Innovations the leading performance monitoring company on the market. We’re pleased to introduce Arun Aravamudhan, Product Head – Web Application Performance Monitoring (APM).
| #1 |
Question: Tell us about yourself. |
 Answer: I am Arun Aravamudhan and I lead the product engineering teams for APM (Application Performance Monitoring) and EUM (End User Monitoring) product lines at eG Innovations. I’ve been in the software industry for 20+ years in various roles including development, architecture and ops across multiple verticals such as banking, e-commerce and telco. I have been an early adopter of APM products since the mid 2000s and my focus has predominantly been on performance tuning and monitoring of large-scale distributed applications.
| #2 |
Question: What attracted you to eG Innovations and what is your role at eG Innovations? |
Answer: eG Innovations offered me the opportunity to take all that I had experienced over the past decades and pour it back into building a great APM product. The company already had a rich heritage in IPM (Infrastructure Performance Monitoring) and I saw an opportunity to spearhead the APM feature set.
At eG Innovations, my role is to execute on our mission to deliver a world-class APM product that provides tangible business value to our customers. We do that by uniting the application and infrastructure perspectives into a holistic single-pane-of-glass solution for monitoring, diagnosis, alerting, reporting, baselining, capacity planning, and more. We call this a “Converged Application and Infrastructure monitoring” solution.
My role is very multifaceted in terms of talking to highly technical customers about their needs in a highly dynamic IT environment, converting that into an executable set of specifications for engineers, and balancing multiple factors to prioritize which features to work on vs. which ones to defer.
| #3 |
Question: What is an APM solution? |
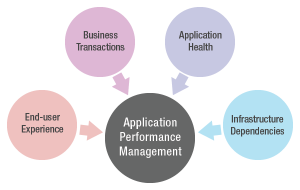 Answer: An APM product helps you assess your application’s performance by showing you the end user experience. It allows you to drill down to the business transactions and the underlying infrastructure health. Imagine a user logging on to a system. The request is sent to a firewall, a load balancer, a web server, an app server, and possibly an authentication server or database. The APM system kicks in and tracks all the calls all the way from the browser to the database and back – the entire communication stream. Was there slowness in any step of the logon call chain? Were there errors? Was it due to the browser or the network or the backend? If it was the backend, was it the code or SQL or 3rd party dependencies or even the underlying infrastructure?
Essentially, the APM solution shows you how data flows across application tiers using a tag-and-follow mechanism, how much time it spends in each tier, and provides you visibility as for why it behaves the way it does.
| #4 |
Question: How did APM fit into what eG Innovations was already delivering? |
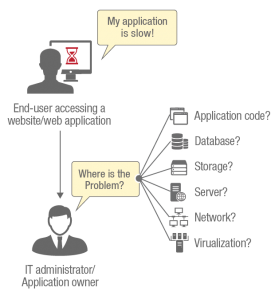 Answer: eG Innovations has been focused on answering the toughest IT performance question of today, which is “why is an application slow?”. There is no easy answer to this. Slowness can arise because of issues in the infrastructure – the server, hardware, cloud platform, storage, database, or infrastructure services like DNS. The eG Enterprise suite from eG Innovations already addressed these aspects of performance monitoring. We realized that problems could also be in the application code itself or in the way the application is querying the database, or in an external service that the application depended on. We realized that APM capabilities were essential if we had to provide reliable answers to the “why is my application slow” question.
| #5 |
Question: What were the goals of the APM project you embarked on? |
Answer: There were several goals:
- We had to provide in-depth visibility into application performance including code-level insights. We had to do this without requiring developers to change their code or add new instrumentation hooks. Furthermore, Java is used widely with COTS applications. For example, SAP Netweaver uses a Java front-end, Siebel and PeopleSoft are based on Java stacks and so on. An APM solution that required application modifications to enable monitoring would have been impractical.
- We had to instrument the application so as to minimize the overhead of the monitoring. A number of other monitors included in eG Enterprise are “out of band” – i.e., they do not run in the application context. On the other hand, APM had to be “in-band”. This brought a totally different set of challenges because any issues with our instrumentation could bring down the application.
- Furthermore, there are several APM solutions already in the market. So we had to look for clear reasons why customers would adopt our solution. We looked for both commercial and technological differentiators.
You can easily begin to build your first ‘Hello APM’ tool, and play around with JVM internals, but building a full APM solution is not for the faint-hearted.
 How to trace transactions across every layer of your distributed software stack
| #6 |
Question: You mentioned not having to change the application code. How did you achieve Java code-level monitoring without changing application code? |
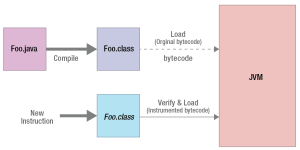 Answer: We use a technique called dynamic bytecode instrumentation which allows us to modify the code of Java applications “on the fly” as they are loaded into memory via a Java agent. It may seem like a crazy notion that applications can modify themselves at runtime, but that’s how the JVM works because Java is a dynamically loaded language. We have capabilities to dynamically attach a Java agent to an already running JVM, such that you don’t need to edit any startup scripts or even restart the application server. In a nutshell, the code is altered – only not on disk but dynamically in the runtime memory.
| #7 |
Question: Hasn’t bytecode instrumentation been around for a while? |
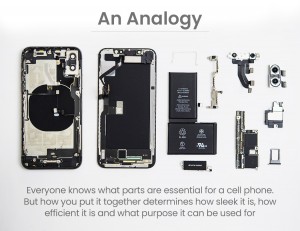 Answer: Bytecode instrumentation is a well-known technique that has existed since Java 1.5. There are open source libraries such as ASM, cglib, javassist and Byte Buddy available to implement Bytecode manipulation. While the mechanism of implementing byte-code instrumentation is straightforward these days, there is a lot of complexity in actually implementing a monitoring solution using byte code instrumentation.
To provide an analogy, the components of a mobile phone are well defined – you need a display, a microphone, a speaker, a network connector, battery, etc. At the same time, going from defining different components of a mobile phone to actually putting together an operational phone is easier said than done. How to create a mobile phone from its components is not a well-defined process. The results may be different depending on the architecture chosen, design decisions made and the process followed. You could end up making a sleek phone like an Apple iPhone, or a functional phone like an early 2000s Nokia mobile.
| #8 |
Question: What does byte-code instrumentation allow you to do? |
Answer: With bytecode instrumentation, you can trace the transaction processing at each application tier. You can identify how much time was spent in each JVM executing Java code, and importantly how much time was spent issuing and waiting for database queries, web service calls to third parties, HTTP calls to other tiers and so on. By knowing exactly where time was spent during transaction processing, administrators can identify what is causing slowness: is it Java code, database queries, web service calls, etc.
| #9 |
Question: Does this level of transaction profiling add overheads? |
Answer: This is where a lot of the challenges lie. To ensure that the overhead was minimal, we had to answer some crucial questions:
- Should each Java method be instrumented? If not, which ones should not be instrumented?
- How long should the instrumentation of a request run for?
- How to determine when to stop instrumenting a request?
- Since the server could be handling thousands of requests, where will the results of instrumentation be stored? Where will these requests be aggregated and how often?
- How to perform aggregation without needing to synchronize among threads, which can be expensive?
- How can this be achieved without affecting the response time experienced by end users?
| #10 |
Question: Was byte-code instrumentation the only challenge with APM? |
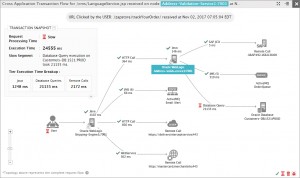 Answer: No. Today, most applications are not silos. Distributed and multi-tier architectures are very common. One application tier communicates with other tiers upstream to it and/or downstream for it. To provide end-to-end visibility, one needs to stitch together the end-to-end flow of a transaction. It is not practical to expect an administrator to drill down into each tier manually and put together the end to end processing flow. This where APM tools use a concept called tag-and-follow tracing mechanism.
Tag and follow is a concept. However, unlike bytecode instrumentation, which is a technique and has many supporting libraries, tag and follow (which is a concept) does not have libraries/tools to implement. Tag-and-follow is easy to conceptualize when the transaction processing is linear as shown in the example below.
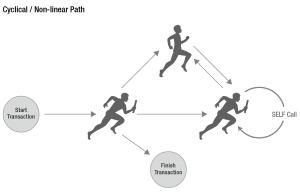 However, real-world application flows are rarely linear and simplistic. The request could jump back and forth across application boundaries with some systems calling themselves (also known as self-calls). Non-linear flows make transaction tracing challenging.
Another challenge pertains to disparate Java frameworks that could virtually be thought of as different application domains. Real-world applications have multiple teams who adopt frameworks that are totally heterogeneous in nature. Some could be OLTP (online transaction processing) systems, while others could be Asynchronous/ Messaging systems. Other systems could be OLAP (online analytical processing) which rely on different types of data stores.
| #11 |
Question: This does indeed sound challenging. What were some of the challenges with tag and follow tracing? |
Answer: In light of the various domain related complexities in tag-and-follow, we had to answer a wide variety of questions:
- Where should the tag be added?
- How can it be added without affecting the functionality of the application being monitored?
- How can the tag be carried across tiers?
- What if each tier uses a different communication mechanism – web service, HTTP, JMX, etc.?
- Should a common timestamp be carried with the tag across tiers to get an end to end view?
- How to keep the tagging information to a minimum (so as to not add load/overhead) and still be able to provide insights across tiers?
- Should time synchronization be done at each tier? Is that even practical?
- What happens if one or more tiers in the path don’t support tagging or the monitoring tool is not deployed in those tiers? How can the end to end picture be constructed in this case?
- Given that the applications receive thousands of requests, it is not possible to store all of their processing data in memory for processing. If only top requests are stored at each tier, how will the request processing map be constructed?
- Should the construction of the map be done from one place, i.e., centralized, or should it be decentralized?
| #12 |
Question: There are many APM solutions in the market. What differentiates eG Enterprise APM? |
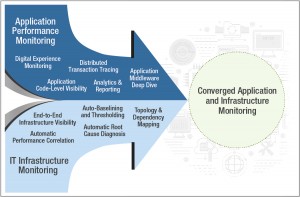 Answer: Our discussions with many customers have shown that APM alone is not sufficient. Neither is IPM (Infrastructure Performance Monitoring). Customers might buy a point APM solution and have to purchase another IPM. Then, you have the headache of integrating the two. If you want to truly address the “why is my application slow” problem, you need to have a converged solution that facilitates true root-cause diagnosis. This is a key differentiator of our solution. From one single console, you can see everything you need in an IT environment – User experience, Business transactions, Application performance & Infrastructure performance.
Deployment of our solution is also much simpler than it is with other solutions. We provide a single universal agent that has all the monitoring capabilities you need for operating systems, application logs, processes, JVMs, web containers, transactions etc. Many other solutions require a separate “machine” agent for the OS and an “application” agent for each application instance.
Licensing is another differentiator. APM solutions have so far been very expensive. They have been licensed by JVM instances – so if you had 5 JVMs on a system, you would need 5 licenses. We license eG Enterprise by operating systems monitored, not by number of JVMs to be monitored. This makes our solution highly cost competitive in a market where APM pricing is often out of reach for many customers.
| #13 |
Question: What does the future hold for eG Enterprise APM? |
Answer: We have a very exciting journey ahead of us! A couple of areas we are looking at
- AI/ML & automation: eG Enterprise already has significant AI capabilities in the areas of intelligent alerting, automatic correlation, trigger automated actions, causality analysis and auto-baselining. We plan to deepen this capability even further in the areas of cross-domain pattern detection, predictive analytics and optimization recommendations.
- Visualization: Today, you can leverage RBAC and role based dashboards in eG, but we will be deepening the persona-driven unified visualization that speaks to different roles in the IT organization such as DevOps, Helpdesk, IT Ops and so on. As an example, today we already capture usernames, IP addresses and can tag any arbitrary business context information for business transactions. We are working on better customer experience journey visualization for line-of-business managers to proactively manage the digital journey.
| #14 |
Question: When you’re not being an #ITPerformanceHero, what do you like to do in your spare time? |
Answer: It’s easy to become engrossed in technology the whole day so I try to hit the gym and swim regularly. It’s not just about the physical aspect – I find exercise to be vital for my mental health. I also love visiting temples and enjoy spiritual chanting.
Thanks, Arun. There are many more #ITPerformanceHeroes at eG Innovations. Stay tuned for more interviews. We can’t wait for you to meet them!
eG Enterprise is an Observability solution for Modern IT. Monitor digital workspaces,
web applications, SaaS services, cloud and containers from a single pane of glass.


