Full-Stack Java Monitoring with Code-Level Visibility
Monitor the JVM, application server, Java code, database queries and more
Why is your Java application slow? Is there a memory leak in the JVM, a blocked thread, high GC activity, bottlenecks in the application server, or code-level errors causing application processing to be slow? Java developers and IT administrators need full-stack visibility of the Java application environment to get to the root cause of performance issues and troubleshoot them.
Watch this online demo and learn how eG Enterprise can help detect and diagnose Java performance problems with automated code-profiling and JVM monitoring. Get full-stack Java monitoring to:
- Track Java application user experience in real time
- Trace business transaction and isolate the reasons for slowness
- Gain code-level visibility to identify errors, long-running queries, slow remote calls
- Obtain insights on the entire Java stack including Java containers (WebLogic, WebSphere, Tomcat, JBoss), JVMs, databases, and supporting infrastructure (servers, VMs, network, storage, etc.)
Get actionable insights to achieve faster troubleshooting, code optimization, and infrastructure right-sizing for your Java environment.

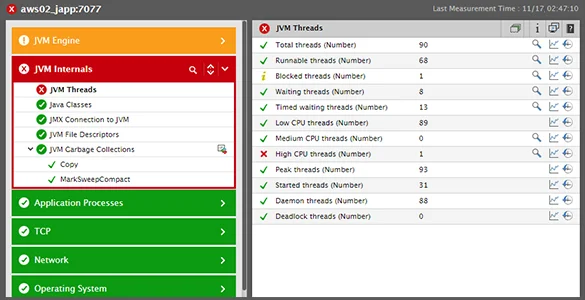
Monitor Java code, business transactions, JVM and the application transactions from one console

