Monitoring A10 Application Delivery Controller
To ensure continuous operation and good health of the A10 Application Delivery Controller, eG Enterprise provides a specialized A10 Application Delivery Controller model (see Figure 1).
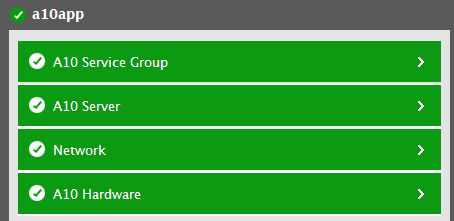
Figure 1 : The layer model of the A10 Application Delivery Controller
Every layer of Figure 1 is mapped to a variety of tests which connect to the SNMP traps and SNMP MIB of the A10 Application Delivery Controller to collect critical statistics pertaining to its performance. The metrics reported by these tests enable administrators to answer the following questions:
- How well the CPU of the A10 Application Delivery Controller has been used?
- How well are the disks of the A10 Application Delivery Controller utilized?
- What is the current state of the fans and is any fan running at abnormal speed?
- What is the current status of each power supply unit? Is any power supply unit absent? If so, which ones?
- What is the current state of the sensor of each voltage unit?
- What is the current health state of each real server and virtual server? How well the real server and virtual server are processing client traffic? Which server is handling the maximum traffic?
- What is the current state of the real server port and the virtual server port? Which port is handling the maximum traffic?
- What is the current health state of the service group and service group member of the A10 Application Delivery Controller? How well the client requests are processed by them? Which service group and service group member are handling the maximum amount of traffic?
Since the Network layer has been dealt with in the Monitoring Cisco Router document, the sections to come will discuss the remaining layers of Figure 1.
