
Monitoring AWS DynamoDB
As mentioned earlier, eG Enterprise provides a specialized model for monitoring AWS DynamoDB (see Figure 1).
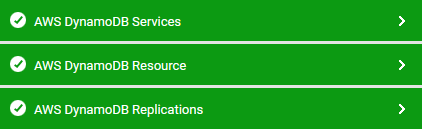
Figure 1 : Layer model of AWS DynamoDB
Each layer of Figure 1 above is mapped to tests that report a variety of metrics revealing the availability, replication, resource usage and much more!
Using these metrics, administrators can find quick and accurate answers to the following persistent performance queries:
-
Are there too many tables with system error?
-
Are there too many user error and system errors on the target server?
-
Whether the network connection is available or not in the target server?
-
Does the database is taking too much time to respond to a query?
-
Whether the database connection is available or not?
-
Does the database is taking too much time to execute the query?
-
Are there too many throttled requests, conditional check failed requests, and transaction conflict requests on the target server?
-
Are there too many read and write throttled events?
-
Are the read and write capacity units rightly provisioned?
-
Are the number and percentage utilization of read and write capacity units too high? If so, then how much?
-
What is the rate of read and write capacity units consumption?
-
What is the percentage of completion when a new global secondary index is being added to a table?
-
Is the request latency too high?
-
Is the age of old unreplicated records too high? If so, then how much?
-
Whether or not replication enabled in the target server?
-
Are there too many unavailable regions on the target server? If so, then how many?
-
Are there too many pending replication by records on the target region?
-
Is the replication region available? What is the region response time?
-
Is the connection time to the replication region too high?
-
Does the region takes too much time to execute the query?
-
Is the replication latency on the target region too high?
