
Adding an ActiveMQ Server Component
eG Enterprise cannot auto-discover the ActiveMQ Server. This implies that you need to manually add an ActiveMQ Server component for monitoring. The steps for manually adding the ActiveMQ Server component are detailed below:
-
Login to the eG administrative interface.
-
Click on the Add Component button in the right corner of the Components at a Glance page that appeared or follow the Infrastructure -> Components -> Add/Modify menu sequence.
-
Then, select the ActiveMQ Server as the Component type and click the Add New Component button. Figure 1 will then appear.
-
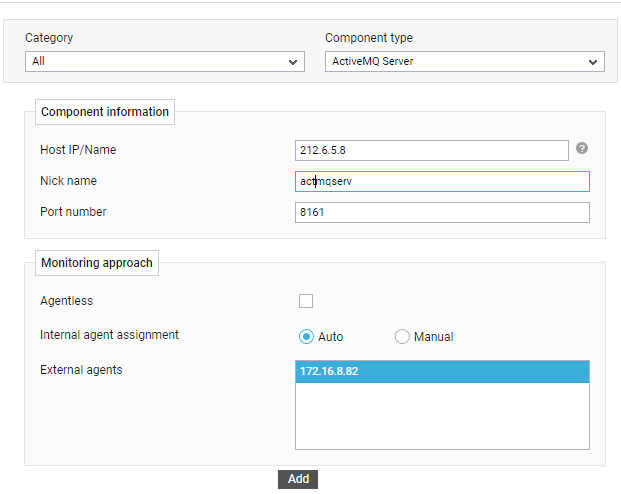
In Figure 1, provide the Host IP/Name of the ActiveMQ Server to be monitored. Then, provide a Nick name for the server.
- By default, the Port number will be set as 1883. If the target server is listening on a different port in your environment, then override this default setting.
- By default, the Agentless check box will be unchecked. The recommended monitoring approach to monitor the target component is agent-based approach. Therefore, it is best to not alter the default setting. However, if you wish to monitor the target component in an agentless manner, then the Agentless check box should be checked.
- By default, the Auto option will be selected against the Internal agent assignment field. This indicates that by default, eG Enterprise maps every configured IP/nick name with a separate internal agent. To manually define the IP-internal agent association, select the Manual option.
- Pick an external agent from the External agents list box and click the Add button to add the component for monitoring.
-
Once the ActiveMQ Server component is added successfully, you will be again redirected to Figure 2. Using the options provided in the page that appeared, you can modify, unmanage or delete the newly added component. In addition, you can also configure the tests, set thresholds and maintenance policies, and change the IP address.

-
To collect the performance metrics, you may need to manually configure the tests that are mapped to the ActiveMQ Server. To configure the tests that need manual configuration, click on the
 icon in Figure 2. This will lead you to the Specific Test Configuration page where the unconfigured tests for the ActiveMQ Server will be listed in the Unconfigured Tests list box.
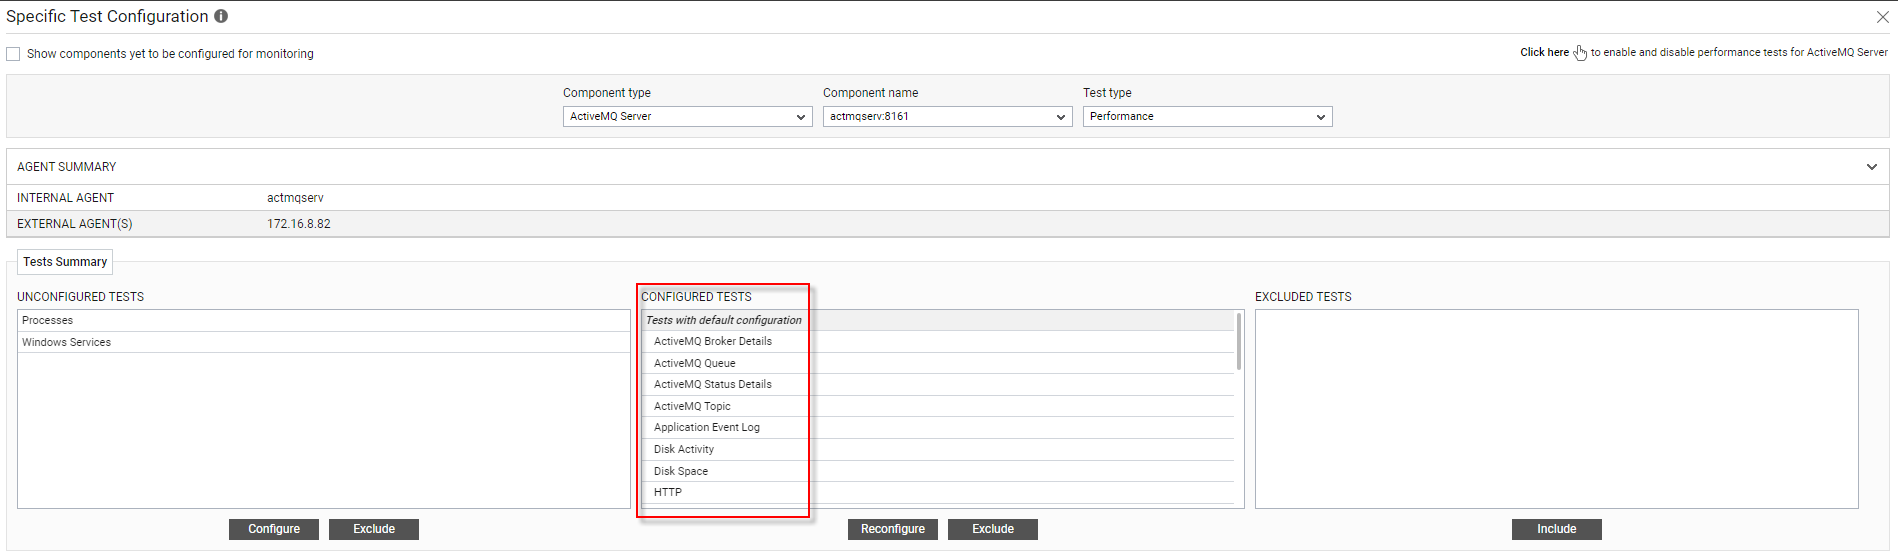
Figure 3 : The list of unconfigured tests for the Swift AMH JBoss component
-
The tests specific to ActiveMQ Server and JVM tests will be auto-configured and listed in the CONFIGURED TEST list box once the target component is added for monitoring.
-
Once all the tests are configured, switch to the Monitor tab to view the performance metrics reported by the tests.
