Monitoring ActiveMQ Server
eG Enterprise offers a special-purpose monitoring model for the ActiveMQ Server to monitor the status and overall performance of the target ActiveMQ Server.

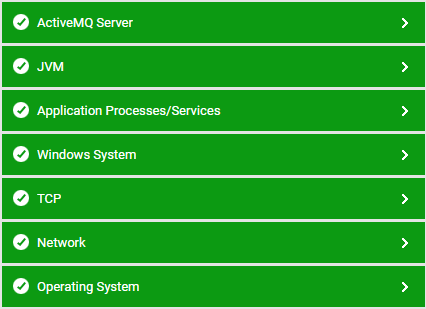
Figure 1 : Layer model for ActiveMQ Server
Every layer in the Figure 1 is mapped to various tests to determine the critical statistics related to the performance of the target ActiveMQ Server. Using the metrics reported by the tests, administrators can find accurate answers for the following performance queries:
-
Is the ActiveMQ Server running? Is the broker process up and responsive?
-
Are the brokers able to handle current load?
-
What is the average size of messages published?
-
How many connections out of total allowed connections are currently active?
-
Is any queue/topic a Dead Letter Queue (DLQ)?
-
Are new clients able to connect to the server successfully?
-
Is the broker able to store the messages without filling up the disk storage?
-
Are there any queues or topics with large backlogs or slow consumers?
-
Are there any warning alerts currently which need to be looked at?
-
Is there a need to add more capacity to the server?
-
Is there sufficient memory available for smooth operation?
Utilizing a monitoring tool or solution that can collect and present this information in a clear and actionable way is essential for effective ActiveMQ monitoring. The metrics reported by the tests mapped to the ActiveMQ Server layer answer these questions and provide actionable insights to administrators. The tests mapped to the last five layers in Figure 1 are already discussed in the Monitoring Unix and Windows Servers document. To know more about the JVM layer and the tests associated with the layer, refer to the Monitoring Java Application document.
