Monitoring BIND DNS
After correctly configuring the tests for BIND DNS, sign out of the eG admin interface. Then, log into the eG monitoring interface for viewing the current state of the managed BIND DNS server and the performance statistics it reports.
To report the real-time state and performance metrics of a BIND DNS server in the eG monitoring console, eG Enterprise uses a specialized Bind DNS monitoring model.

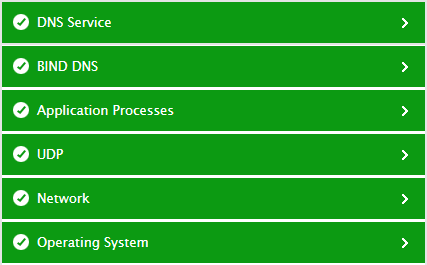
Figure 1 : Layer model of BIND DNS
Each layer of this hierarchical model is mapped to tests that periodically verify and report on the availability, responsiveness, and operational efficiency of BIND DNS. Using the measures reported by these tests, administrators can find quick and accurate answers to persistent performance queries related to BIND DNS; these include the following:
- Is the BIND DNS server accessible over the network? If so, how responsive is it to requests?
- What is the query load on BIND DNS? What Resource Record is contributing to that load? Is the server sized with adequate resources to handle the load?
- Did any query to BIND DNS result in an error response? If so, what type of response is it and what caused it?
- Were any queries rejected?
- Were any queries dropped?
- Is the resolver program delaying query processing? Are any queries taking an unusually long time to be processed by the resolver?
- Did any query fail at the resolver?
- Did the resolver retry many queries?
- Did the resolver receiver any error responses for the queries it forwarded? If so, what type of responses?
- Were zone transfers smooth, or did any transfer requests fail?
- Were notifies rejected during zone transfers?
- Did socket binding fail?
The bottom 4 layers of Figure 1 have been dealt with elaborately in the Monitoring Unix and Windows Servers