Monitoring Coyote Load Balancer
Figure 1 shows the dedicated Coyote Load Balancer monitoring model offered by eG Enterprise .
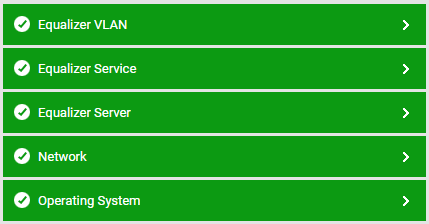
Figure 1 : Layer model of Coyote Load Balancer
Each layer of Figure 1 is mapped to a variety of tests that provide valuable insights into the overall performance of the Coyote Load Balancer. With the help of the metrics reported by these tests, administrators can find quick and accurate answers for the following queries:
-
Is the peer server in a failover mode?
-
How much traffic is the load balancer handling? How many connections?
-
Is network load balanced across all the servers in the pool?
-
Are client connections to a cluster uniformly distributed across all the servers in that cluster? If not, what is the reason for the imbalance?
-
Which cluster is currently handling the maximum number of connections?
Since the tests pertaining to the Networkand Operating System layer have already been discussed in the Monitoring Unix and Windows Servers document, the sections to come will discuss the tests associated with the remaining layers alone.
