Monitoring the FortiGate Firewall v3x
Figure 1 below depicts the Fortigate Firewall 3x monitoring model offered out-of-the-box by the eG Enterprise. As stated earlier, this model focuses on the overall health of the FortiGate Firewall v3 (and its variants).
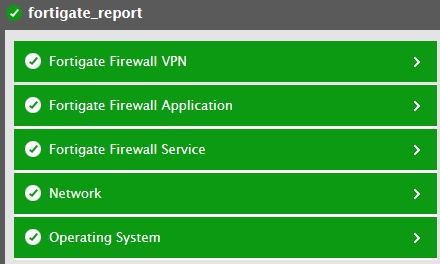
Figure 1 : Layer model of the FortiGate Firewall
Every layer displayed by Figure 1 is mapped to a series of tests, which when executed on the firewall reveals a wealth of performance information pertaining to the firewall. These statistics provide quick and accurate answers to the following frequently asked performance-oriented questions:
- Has the firewall been consuming excessive CPU, memory, and disk resources?
- Are too many sessions currently active on the firewall?
- Is the network and data traffic on the firewall cluster unit very heavy?
- How effective are the anti-virus and IPS mechanisms configured on the firewall cluster unit? Have they been able to detect and prevent all attempted attacks?
- How many packets and data was transmitted/received (processed) for each firewall policy configured on the FortiGate firewall?
- How many intrusions were detected and blocked by the firewall?
- Were signature intrusions detected? If so, how many signature intrusions were detected by the firewall?
- How many HTTP/HTTPS URLs were blocked?
- How many cookies were blocked altogether?
- How many HTTP/HTTPS requests were examined and sent through the web content filter?
- How many HTTP/HTTPS requests were blocked by the web content filter of the firewall?
- What is the current state of each VPN tunnel?
- How well data was transmitted/received through each VPN tunnel?
- What is the current state of each SSL VPN tunnel?
- How many users were logged in through the SSL VPN?
- How many users are currently active on each SSL VPN tunnel?
- How many sessions are currently active on each SSL VPN tunnel?
- What is the rate at which data was transmitted/received for each user through the SSL VPN using the tunnel mode?
- How many users are currently logged in through the SSL VPN using tunnel mode?
- How many users actually logged out of the SSL VPN?
- How many users were registered on the firewall?
- How many users were enabled on the firewall and how many users were actually disabled on the firewall?
- How well memory was utilized by each proxy server on the firewall?
- How many connections were utilized by each proxy server connection?
- What is the maximum number of connection supported by each proxy server?
- How many files were scanned by each scan unit of the firewall?
- How many peer-to-peer connections were blocked and how well data was transmitted using peer-to-peer protocol?
- How well the CPU was utilized by each processor of the firewall?
- How many messages were processed for the Instant Messenger protocol?
- How many files were transferred using the Instant Messenger protocol and how many files were blocked?
- How many connections were blocked while using the Instant messenger protocol?
- How many VOIP connections were currently active on the firewall and how many VOIP connections were blocked?
The sections that follow discuss in detail all other layers except the Network layer which has been extensively dealt in the Monitoring Unix and Windows Servers document.
