Monitoring the Hitachi Compute Blade
eG Enterprise offers a specialized Hitachi Compute Blade monitoring model that monitors the core hardware components of the Hitachi Compute Blade, and proactively alerts administrators to issues in its overall health and performance, so that abnormalities can be fixed before irreparable damage occurs.

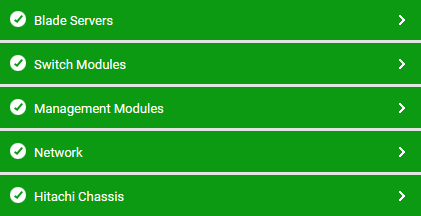
Figure 1 : The layer model of the Hitachi Compute Blade
By continuously monitoring the Hitachi Compute Blade, administrators can answer the following performance questions:
- What is the current status and color of each LED available in each Switch Module?
- What is the health and power supply status of each Switch Module?
- Is any Switch Module under maintenance mode?
- What is the current health and power supply status of each Power Supply Module?
- What is the current health and power supply status of each Management Module?
- Is any Management Module under maintenance mode?
- What is the current status and color of each LED available in each Management Module?
- What is the current status and color of the LED available in each Fan Module?
- What is the current health and power supply status of each Fan Module?
- Is any Fan Module under maintenance mode?
- What is the current speed of each fan in each Fan Module?
- What is the current voltage of the chassis?
- What is the current temperature of the chassis?
- What is the power consumed by the chassis?
- What is the power supply status of the chassis?
- What is the current status and color of each LED available in the chassis?
- What is the current health, power supply status and temperature of each blade server?
- Is the blade server in maintenance mode?
- In a redundant configuration, is the blade server a primary blade?
- What is the current status and color of each LED in the blade server?
Since the tests of the Network layer have already been discussed in the Monitoring Unix and Windows servers and Monitoring Network Elements documents in details, the sections to come will discuss all other layers of Figure 1 in detail.


