
Monitoring IBM Datapower
eG Enterprise offers a special-purpose monitoring model for the IBM Datapower to monitor the status and overall performance of the target IBM Datapower.
Figure 1 depicts the layer model of a IBM Datapower.
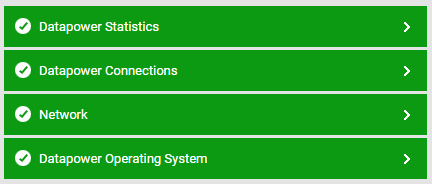
Figure 1 : Layer model for IBM Datapower
Every layer in the Figure 1 is mapped to various tests to determine the critical statistics related to the performance of the target IBM Datapower. Using the metrics reported by the tests, administrators can find accurate answers for the following performance queries:
-
Is the encrypted, unencrypted, temporary and internal space used by IBM Datapower device is high?
-
Is the amount of space used by RAID in the target device is high?
-
Is the total system load for the task during the measurement interval is low?
-
Is the number of users who logged into the target device is high?
-
Is the number of users who disconnected from the target device is high?
-
Are the connections accepted by the target Datapower device at specified time intervals is high?
-
Are the HTTP connections that were requested, reused, created and returned at specified time intervals on the target device are high?
-
Is the average CPU usage of the Datapower device at specified time intervals is high?
-
Is the current temperature of the system recorded by the temperature sensor is too high?
-
Is the power supply unit in the target device undergone any power failure?
-
Is there sufficient amount of total, used and free memory space on IBM Datapower device?
-
Is the memory utilized by the target device is high?
Since the tests mapped to the Network Layer have been elaborately discussed in Monitoring Cisco Router document, the sections to come will discuss the other layers in detail.
