Monitoring Juniper QFX Switch
eG Enterprise provides a specialized Juniper QFX Switch monitoring model (see Figure 1), which periodically polls the SNMP MIB of the switch to measure the CPU usage, temperature and memory of each hardware component of the switch and notifies administrators of potential resource crunches and failures of the power supply, fans etc.
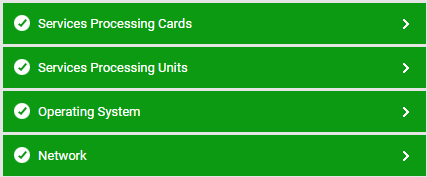
Figure 1 : The layer model of the Juniper QFX Switch
Using the metrics reported , administrators can find quick and accurate answers for the following performance questions:
- Is the CPU utilization of each hardware component optimal? If not, which hardware component is utilizing the maximum CPU?
- Is any of the hardware components of the target switch choking due to the excessive CPU load?
- Is there any hardware component of the target switch down or running at abnormal speed?
- Which hardware component is consuming the maximum memory resources? Is the buffer memory and heap memory allocated to each hardware component utilized effectively?
- Is the temperature maintained optimally for all the hardware components of the Juniper QFX Switch?
- Is any VPN tunnel hogging the bandwidth resources? If so, which one is it?
- How well the kernel memory is utilized by the switch?
- Are too many fragmented packets flowing through the firewall? If so, why? Is it because of an incorrect configuration?
- What is the mode of the routing engine available in the Juniper QFX Switch?
The Network layer of the Juniper QFX Switch model is similar to that of a Windows Generic server model. The tests associated to the Network layer have been dealt with in the Unix and Windows Servers
