Monitoring Juniper SRX
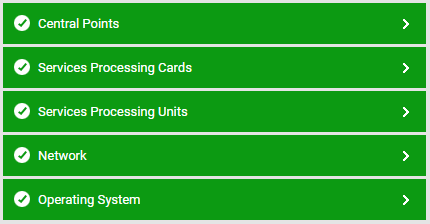
eG Enterprise provides a specialized Juniper SRX monitoring model (see Figure 1), which periodically polls the SNMP MIB of the firewall to measure the CPU usage, SRX sessions, NAT details, host resources and memory of the firewall and notifies administrators of potential resource crunches and consumption of CPU and memory etc.

Figure 1 : The layer model of the Juniper SRX Firewall
Using the metrics reported , administrators can find quick and accurate answers for the following performance questions:
- Is the CPU utilization of each CPU of the target SRX firewall optimal? If not, which request is utilizing the maximum CPU?
- Are the requests consuming too much of CPU resources of each SPU available in the Juniper SRX firewall ?
- Is there any hardware component of the target switch down or running at abnormal speed?
- Is the buffer memory having a glitch which delaying the process, or data loss or even causing complete halt of firewall operation?
- Is there any issue in forwarding engine process and the message is not passing to the right destination?
- How well the SPU memory is utilized of the firewall?
- Are rules not being executed on incoming traffic?.Is it because of an incorrect NAT configuration?
The Network layer of the Juniper SRX model is similar to that of a Windows Generic server model. The tests associated to the Network layer have been dealt with in the Unix and Windows Servers


