Monitoring Microsoft Azure AD Connect
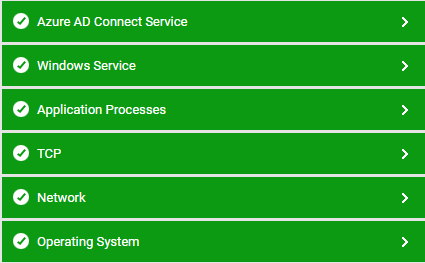
eG Enterprise provides a specialized model for monitoring the Azure AD Connect server (see Figure 1).

Figure 1 : Layer model of Microsoft Azure AD Connect
Each layer of Figure 1 is mapped to tests that measure the health of the Azure AD Connect server. With the help of these metrics, administrators can find quick and accurate answers to the following performance queries:
-
Is the Azure AD Connect server available over the network? If so, how quickly is it responding to requests?
-
Is the server sized with adequate CPU/memory/storage resources?
-
Is the Azure AD Connect server able to connect to the local / on-premises Domain Controller?
-
Is the DNS server accessible from the Azure AD Connect server?
-
Is the endpoint accessible?
-
Is any connector idle?
-
Did any connector's sync profile fail to copy objects and their attribute values?
-
Is any connector performing synchronization slowly? If so, which connector is it, and why? Is it because the connector has too many objects need to be exported? is it because many objects/attributes to be exported are not found in the metaverse? or is it because the objects/attributes are not linked to the metaverse?
-
Is the Azure AD Domain Service (DS) in an unhealthy state?
-
Is the Azure AD DS slow in servicing NTLM and/or Kerberos authentication requests?
-
Are there any open alerts for the Azure AD DS? If so, what are the problems the service is experiencing?
-
Is the Azure AD Federation Service healthy currently, or were any alerts raised on the service recently? If service problems were noticed, then what are they?
-
Is scheduler configuration mismatched between the active and passive Connect servers in an HA setup? If so, which settings are mismatched?
-
Is the AD Connect Sync service healthy currently, or were any alerts raised on the service recently? If service problems were noticed, then what are they?
For tests mapped to the other layers, refer to Monitoring Unix and Windows Servers .
