
Microsoft Intune Admin Center Test
Microsoft Intune Admin Center is a web-based console that helps administrators to manage and secure devices and applications in an organization. It is a part of Microsoft Endpoint Manager suite, which includes Intune for cloud-based device management and Configuration Manager for on-premises management. The centralized interface enables administrators to oversee and control various aspects of their organization's devices and applications, offering a more efficient and secure way to manage endpoints across different platforms.
For Microsoft Intune to function properly and manage devices in the organizations, a host using which the Intune Admin Center is being accessed should be available and responsive at all time. If the target host becomes unavailable or unresponsive due to various reasons, users will not be able to access the devices managed by Intune. This in turn will impact user productivity and organization's revenue and reliability. To avoid such anomalies, administrators should perform regular checks on availability and responsiveness of the target host at periodic intervals. This can be easily achieved using the Microsoft Intune Admin Center test. This test monitors the target host and reports the availability and how long it takes to respond to the requests.
Target of the Test: Microsoft Azure Intune
Agent deploying the test: A remote agent
Output of the test: One set of results for the target host using which the Azure Intune is being accessed
| Parameters | Description |
|---|---|
|
Test Period |
How often should the test be executed. |
|
Host |
The host for which the test is to be configured. |
| Port |
The port to which the target host listens. |
|
URL |
This test emulates a user accessing Microsoft Intune Admin Center on the target host to determine the availability and responsiveness of the host. To enable this emulation, you need to configure the test with the URL of the admin center that it should access. Specify this URL against the URL parameter. If required, you can even configure multiple URLs – one each for every web page that the test should attempt to access. If each URL configured requires special permissions for logging in, then, you need to configure the test with separate credentials for logging into every URL. Likewise, you need to provide instructions to the test on how to validate the content returned by every URL, and also set an encoding format for each URL. To enable administrators to easily configure the above per URL, eG Enterprise provides a special interface. To access this interface, click on the encircled ‘+’ button alongside the URL text box in the test configuration page. To know how to use this special interface, refer to Configuring Multiple URLs for Monitoring. |
|
Cookiefile |
Whether any cookies being returned by the target host need to be saved locally and returned with subsequent requests |
|
ProxyHost and ProxyPort |
In some environments, all communication with the Azure cloud be routed through a proxy server. In such environments, you should make sure that the eG agent connects to the cloud via the proxy server and collects metrics. To enable metrics collection via a proxy, specify the IP address of the proxy server and the port at which the server listens against the ProxyHost and ProxyPort parameters. By default, these parameters are set to none, indicating that the eG agent is not configured to communicate via a proxy, by default. |
|
ProxyUsername, ProxyPassword, Confirm Password |
If the proxy server requires authentication, then, specify a valid proxy user name and password in the Proxy Username and Proxy Password parameters, respectively. Then, confirm the password by retyping it in the Confirm Password text box. If no proxy server is used, or if the proxy server used does not require authentication, then the default setting - none - of these parameters, need not be changed. |
|
Include User Agent in Header |
A user agent is a computer program representing a person - for example, a browser in a Web context. Besides a browser, a user agent could be a bot scraping webpages, a download manager, or another app accessing the Web. Along with each request they make to the server, browsers include a self-identifying User-Agent HTTP header called a user agent (UA) string. This string often identifies the browser, its version number, and its host operating system. Some web sites may have been designed to service only those access requests that contain the User Agent (UA) string in the HTTP request header. If this test has been configured with the URL of such a web site/web page, then you have to instruct the test to include the UA string in the header of every connection request it sends to the configured URL; if this is not done, then the test will fail. In this case therefore, set the value of the Include UserAgent in Header flag to true. By default, this flag is set to false, indicating that the requests this test emulates do not contain the UA string by default. |
|
Timeout |
Here, specify the maximum duration (in seconds) for which the test will wait for a response from the server. The default Timeout period is 30 seconds. |
|
Report DNS Time |
DNS lookups can cause significant delays in rendering a webpage. To avoid such delays, administrators may want to know how long the DNS server takes to respond to the requests. To help administrators in this regard, this test reports the DNS response time measure when the Report DNS Time flag is set to Yes. By default, this flag is set to No indicating that this test will not report the DNS response time measure by default. |
|
DD Frequency |
Refers to the frequency with which detailed diagnosis measures are to be generated for this test. The default is 1:1. This indicates that, by default, detailed measures will be generated every time this test runs, and also every time the test detects a problem. You can modify this frequency, if you so desire. Also, if you intend to disable the detailed diagnosis capability for this test, you can do so by specifying none against DD frequency. |
|
Detailed Diagnosis |
To make diagnosis more efficient and accurate, the eG Enterprise embeds an optional detailed diagnostic capability. With this capability, the eG agents can be configured to run detailed, more elaborate tests as and when specific problems are detected. To enable the detailed diagnosis capability of this test for a particular server, choose the On option. To disable the capability, click on the Off option. The option to selectively enable/disable the detailed diagnosis capability will be available only if the following conditions are fulfilled:
|
| Measurement | Description | Measurement Unit | Interpretation |
|---|---|---|---|
|
Web availability |
Indicates whether the host using which the console was accessed was able to respond successfully to the query made by the test. |
Percent |
Availability failures could be caused by several factors such as the web server process(es) being down, the web server being misconfigured, a network failure, etc. Temporary unavailability may also occur if the web server is overloaded. Availability is determined based on the response code returned by the server. A response code between 200 to 300 indicates that the server is available. |
|
Total response time |
Indicates the time taken by the console to respond to the requests it receives. |
Secs |
Response time being high denotes a problem. Poor response times may be due to the server being overloaded or misconfigured. If the URL accessed involves the generation of dynamic content by the server, backend problems (e.g., an overload at the application server or a database failure) can also result in an increase in response time. |
|
TCP connection availability |
Indicates whether the test managed to establish a TCP connection to the server. |
Percent |
Failure to establish a TCP connection may imply that either the web server process is not up, or that the process is not operating correctly. In some cases of extreme overload, the failure to establish a TCP connection may be a transient condition. As the load subsides, the server may start functioning properly again. |
|
TCP connect time |
This measure quantifies the time for establishing a TCP connection to the web server host. |
Secs |
Typically, the TCP connection establishment must be very small (of the order of a few milliseconds). Since TCP connection establishment is handled at the OS-level, rather than by the application, an increase in this value signifies a system-level bottleneck on the host that supports the web server. |
|
TCP connect time |
This measure indicates the time period between when the connection was established and when the server sent back a HTTP response header to the client. |
Secs |
While the total response time may depend on several factors, the server response time is typically, a very good indicator of a server bottleneck (e.g., because all the available server threads or processes are in use). |
|
Content validity |
This measure validates whether the server was successful in executing the request made to it. |
Percent |
A value of 100% indicates that the content returned by the test is valid. A value of 0% indicates that the content may not be valid. This capability for content validation is especially important for multi-tier web applications. For example, a user may not be able to login to the web site but the server may reply back with a valid HTML page where in the error message, say, "Invalid Login" is reported. In this case, the availability will be 100 % (since we got a valid HTML response). If the test is configured such that the content parameter should exclude the string "Invalid Login," in the above scenario content validity would have a value 0. |
|
Response code |
The response code returned by the server for the simulated request |
Number |
A value between 200 and 300 indicates a good response. A 4xx value indicates a problem with the requested content (eg., page not found). A 5xx value indicates a server error. |
|
Content length |
The size of the content returned by the server |
Kbytes |
Typically the content length returned by the server for a specific URL should be the same across time. Any change in this metric may indicate the need for further investigation on the server side. |
|
Data transfer time |
Indicates the time taken for a data transfer between the drive and the host system. |
Secs |
Data transfer time being high denotes a problem. |
|
DNS availability |
Indicates whether the DNS server was able to respond successfully to the request made to it. |
Percent |
While the value 100 for this measure indicates that the DNS server is available and successfully responded to the request, the value 0 indicates that the DNS server is unavailable or is not responding to requests. Availability failures could be caused by many reasons such as a network failure. Sometimes, the DNS server may be reachable through basic network testing, but may not respond to DNS queries from clients. Note: This measure will be able to report a value only if the URL parameter of the test is configured with a domain name-based URL – eg., http://www.eginnovations.com, http://www.eBooks.com. If the url parameter is configured with an IP-based URL instead – eg., http://192.168.10.21:80, http://192.168.10.34:7077 – then, this measure will not report any value. This is because, to report the availability of the DNS server, the test attempts to connect to the DNS server and resolve the domain name in the URL to its IP address. If the test is able to perform domain name – IP address resolution successfully, it reports the value 100 for this measure. If the resolution fails, the test reports the value 0. In case of an IP-based URL naturally, the test will not be able to find any domain name to resolve. The test therefore will not report any value for this measure in that case. |
|
DNS response time |
Indicates the amount of time taken by the DNS server to respond to a request made to it. This measure will appear only if the Report DNS Time parameter is set to Yes. |
Seconds |
A low value is preferred for this measure. A sudden/gradual soar in the value of this measure may indicate the deterioration in user experience. |
Configuring Multiple URLs for Monitoring
By default, the Microsoft Intune Admin Center test will be configured with the URL of the Microsoft Azure Intune console. If you wish to monitor additional URLs using this test, then do the following to configure additional URLs:
-
Click on the encircled ‘+’ button alongside the URL text box in Figure 1.
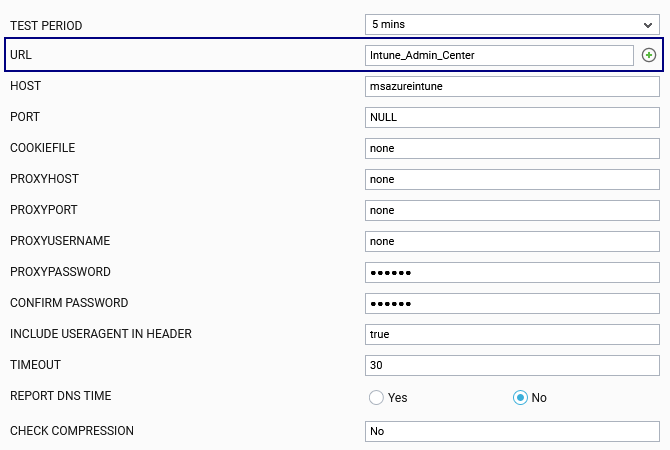
Figure 1 : Configuring the Microsoft Intune Admin Center test
-
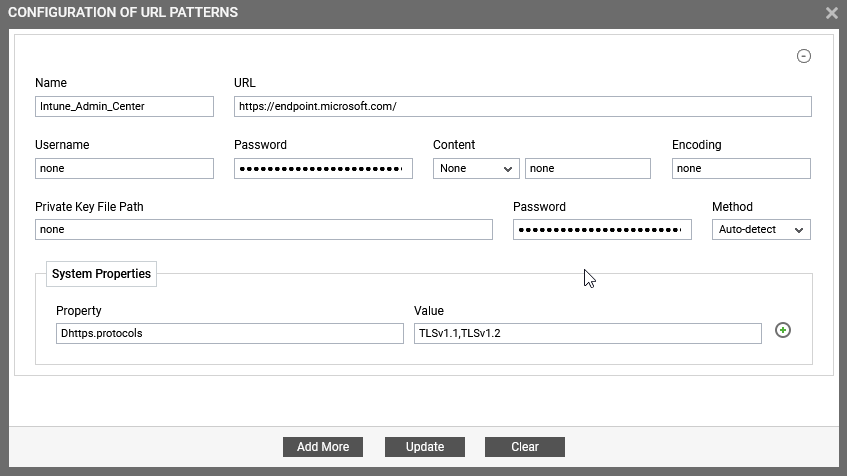
Figure 2 then appears. If you wish to monitor another URL using this test, then click the Add More button in Figure 2.
-
Another URL specification section will appear. Specify the following in that section:
-
Name: Specify a unique name by which the URL you will be specifying shortly will be referred to across the eG user interface. This is the name that will appear as the descriptor of this test.
-
URL: Enter the URL of the web page that this test should access.
-
Username and Password: These parameters are to be set only if a specific user name / password has to be specified to login to the web page (i.e., URL ) that you have configured for monitoring. In this case, provide valid login credentials using the Username and Password text boxes. If the URL configured for monitoring supports ‘Anonymous user access’, then these parameters will take either of the following values:
-
A valid Username and Password for the configured URL
-
none in both the Username and Password text boxes of the configured URL, if no user authorization is required.
Some web servers however, support NTLM (Integrated Windows) authentication, where valid login credentials are mandatory. In other words, a none specification will not be supported by such web servers. Therefore, in this case, against each configured URL, you will have to provide a valid Username in the format:domainname\username, followed by a valid Password.
Please be sure to check if your URL requires HTTP authentication while configuring this parameter. HTTP authentication typically involves a separate pop-up window when you try to access the page. Many sites use HTTP POST for obtaining the user name and password and validating the user login. In such cases, the username and password have to be provided as part of the POST information.
-
-
Content: The Content parameter has to be configured with an instruction:value pair that will be used to validate the content being returned by the test. If the Content value is None, no validation is performed. On the other hand, if you pick the Include option from the Content list, it indicates to the test that for the content returned by the web server to be valid, the content must include the specified value (a simple string search is done in this case). This value should be specified in the adjacent text box. Similarly, if the Exclude option is chosen from the Content drop-down, it indicates to the test that the server’s output is valid if it does not contain the value specified in the adjacent text box. The Include or Exclude value you specify in the text box can include wildcard characters. For example, an Include instruction can be *Home page*.
-
Encoding: Sometimes the eG agent has to parse the URL content with specific encoding other than the default (ISO-8859-1) encoding. In such a case, specify the type of encoding using which the eG agent can parse the URL content in the Encoding text box. By default, this value is none.
-
Private Key File Path and Password: SSL-enabled web sites are typically secured by a private key, public key, or a public-private key pair. If the web page configured for this test is SSL-enabled – i.e., if an HTTPS URL is specified against URL – and the contents of this web page can only be accessed using a private key, then the full path to the private key file will have to be provided against Private key file path and the password of the private key file should be specified against Password. If no such private key protects the contents of the configured URL, then set the Private Key File Path and its Password to none.
-
Method: Using this parameter, you can indicate how you want the eG agent to execute this test. If you want the eG agent to always run this test using the Java executable alone, then pick the Only Java option from the Method drop-down. Likewise, if you want the eG agent to always run this test using the cURL utility alone, then choose the Only cURL option from the Method drop-down. On the other hand, if you want the eG agent to automatically detect what methodology was successful in reporting metrics for this test during the last measure period, and employ the same methodology to run the test during the current measure period, then you need to go with the default selection - i.e., Auto-detect. This default setting is useful in environments where neither methodology (Java or cURL) can be relied upon to continuously report metrics for this test. In other words. the default setting is ideal for environments where the Java executable may have been successful in collecting metrics a few times, and the cURL utility may have been successful at other times.
-
System Properties - Property and Value : Some web pages (URLs) configured for monitoring may have been designed to allow access for only those requests that have certain specific properties enabled. For instance, web pages of an SSL-enabled web site may have been designed to support TLS v1.3 requests alone. In such a case, you will have to instruct the test to send connection requests to the configured URL over the TLS v1.3 protocol alone; if not, the test will fail. For this, you can use the Property and Value text boxes in the System Properties section. Specify the request property that the test needs to look up, in the Property text box. In the Value text box, enter the value this property should be set to, so that the eG agent is allowed access to the configured web page. In the case of the above example, you will have to specify -Dhttps.protocol in the Property text box and TLSv1.3 in the Value text box. You can even provide a comma-separated list of values in the Value text box. For example, if the web page supports multiple versions of the TLS protocol, then the Value specification will be: TLSv1.1,TLSv1.2,TLSv1.3. You can even configure more than one Property:Value pair, if the configured URL supports multiple properties. To add another pair, click on the encircled '+' button adjacent to the Value text box.
-
- Similarly, you can add multiple URL specifications. To remove a URL specification, click on the encircled ‘-‘ button corresponding to it. To clear all URL specifications, click the Clear button in Figure 2. To update all the changes you made, click the Update button.
-
Once Update is clicked, you will return to the test configuration page. The url text box in the test configuration page will display just the Names – i.e., the unique display names – that you may have configured for the multiple URLs, as a comma-separated list. To view the complete URL specification, click the encircled ‘’+’ button alongside the url text box, once again.
