
Business Dashboard
IT executives often require a high-level view of the performance of their mission-critical business services. The Business Dashboard provides this view in a form that is easy to comprehend and analyze. This dashboard quickly compares service demand with resource consumption and service quality to enable IT executives swiftly determine where service performance is most likely bottlenecked – at the demand level? resource consumption level? or user experience level? Moreover, it allows IT executives to rapidly triage performance issues tier-wise, so that they can accurately isolate the tier where the problem originated.
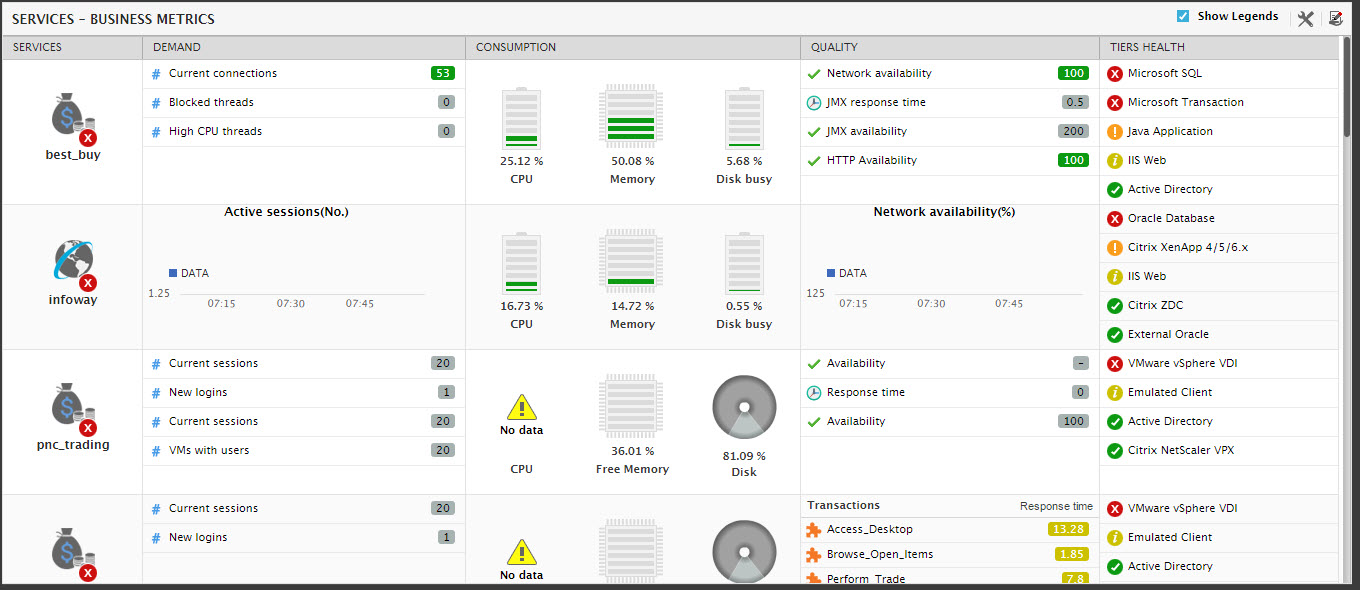
Figure 1 : The Business Dashboard
You can customize the Business Dashboard to include demand, consumption, and quality indicators of your choice. For this, do the following:
Click the  icon to the right, top corner of the Business dashboard (as indicated by Figure 1). Figure 2 will then appear.

Figure 2 : Configuring the business dashboard
- In the configuration settings window, first select the service to which the changes apply from the Applies to drop-down. The steps that follow will vary depending upon your choice of service. By default, the All Services option will be selected, indicating that the settings being configured apply to all services by default. However, if you want to make changes to a particular service’s settings alone, select the service of interest from the Applies to list.
-
If you go with the default selection (i.e., the All Services option) of the Applies to list, then follow the steps below to configure your dashboard:
- First, indicate which Column of the dashboard you intend to alter – Demand, Consumption, or Quality.
- Then, pick a specific service type from the Service Types list. This implies that the changes you make subsequently will apply to all services of that type.
- Next, select a component type from the Filter by Component Type list. This list will display all component types that are engaged in delivering all the managed services in the environment.
- Once a component type is chosen from this list, then the configuration window will display a table listing all measures related to that component type that have been pre-configured (if any) for display in the selected Column for all services of the chosen Service Type. If no such pre-configuration exists, then the table will be empty.
- You can either modify/delete any of the listed measures or add more measures to the chosen Column.
- To add a measure, first click the Add button in Figure 2.
-
When Figure 3 appears, select a Layer from all layers that are key to the performance of the Service Type selected. For instance, if Citrix XenApp Access is the Service Type chosen, then the Layer list will include all layers of the Citrix XenApp component that is imperative to a service of that type.

- Pick a Test mapped to the chosen Layer.
- Select the Measure that you want displayed in the chosen Column of the dashboard.
-
If the chosen Test is a descriptor-based test, then, before adding any measure reported by that test, you should aggregate the measure value across all descriptors using a specific aggregate function. The result of this aggregation is then displayed in the dashboard. For this, pick a Function.

Figure 4 : Adding a measure that supports descriptors
- Next, provide a Display Name for the measure.
- Click the Add button to add the measure. Similarly, you can add multiple measures to a column.
- Once you are done adding, click ok to exit the add measure pop-up.
-
The measure so added will then be appended to the measure list in the configuration settings window.

Figure 5 : Added measure displayed in the configuration window
-
To modify any of the listed measures, simply select the row representing that measure in Figure 5 and click the Modify button. When Figure 6 appears, you can change the Display Name of the chosen measure. In case of descriptor-based measures, you have the additional option of picking a different aggregate Function for the measure from Figure 6. Finally, click the ok button in Figure 6.

- To delete a pre-existing measure, select the row representing that measure in Figure 5 and click the Delete button.
-
Now, if a specific service is chosen from the Applies to list, then follow the steps below to configure the dashboard:
- First, indicate which Column of the dashboard you intend to alter – Demand, Consumption, or Quality.
-
Upon selecting a Column, the configuration setings window will automatically display the measures related to the chosen service that have already been configured for display in that column. If no pre-configuration exists, then no measures will be displayed.

Figure 7 : Configuring the dashboard settings for a specific service
- You can either modify/delete any of the listed measures or add more measures to the chosen Column. To add a measure, click the Add button in Figure 7.
-
Figure 8 will then appear. Of the Comp Types that are part of the chosen service, select the component type from which measures are to be added to the dashboard.

Figure 8 : Adding a measure that applies to a specific service in the business dashboard
- From the Comp Name list, select a service component of the chosen type.
- Pick the Layer and the Test to which the measure to be added is mapped.
- Select the Measure to be added.
- If the chosen Test is a descriptor-based test, then choose the Function using which the chosen measure’s values are to be aggregated across all descriptors of the test.
- Provide a Display Name for the measure.
- Click the Add button to add the measure. Similarly, you can add multiple measures to a column.
- Once you are done adding, click ok to exit the add measure pop-up.
-
The measure so added will then be appended to the measure list in the configuration settings window.

Figure 9 : Added measure displayed in the configuration window
-
To modify any of the listed measures, simply select the row representing that measure in Figure 10.9 and click the Modify button. When Figure 10.10 appears, you can change the Display Name of the chosen measure. In case of descriptor-based measures, you have the additional option of picking a different aggregate Function for the measure from Figure 10.10. Finally, click the ok button in Figure 10.10.

Figure 10 : Modifying a measure that applies to a specific service
- To delete a pre-existing measure, select the row representing that measure in Figure 10.9 and click the Delete button.
You can also hide those services that you deem inconsequential from the business dashboard, so that you can focus on those services that are critical to you from a performance perspective. The capability to ‘hide’ services is not available by default. To enable this capability, do the following:
- Edit the eg_serviceperfdash.ini in the <eG_INSTALL_DIR>\manager\config directory.
- In the [services_user_config] section, set the admin:enableServiceSkipReorder parameter to true (default is false).
- Save the file.
Once this is done, then, to show/hide services, follow the steps below:
- Click the icon to the right, top corner of the business dashboard to open the configuration settings window.
-
You will find a new What would you like to do? drop-down in Figure 11 that then appears.

Figure 11 : The Configuration Settings window with the option to show/hide services from the dashboard
-
Select the Show/Hide Services option from the What would you like to do? drop-down.
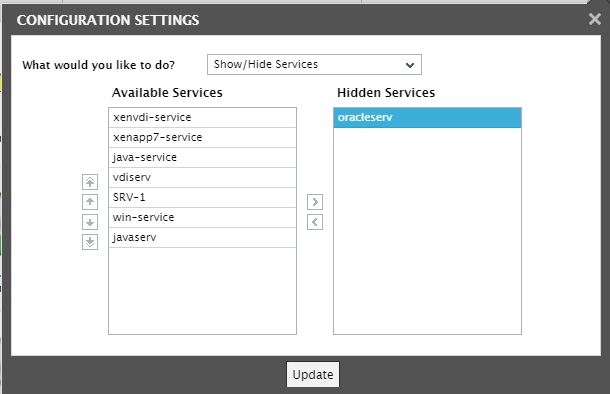
- To hide a service, select it from the Available Services list in Figure 10.130 and then click the > button. This will transfer the selection to the Hidden Services list (see Figure 12). Likewise, you can add multiple services to the Hidden Services list.
-
You can also rearrange the order in which services are to be listed in the dashboard. This way, you can have your mission-critical services on top, and the less critical ones at the bottom of the dashboard. To achieve this, select a service from the Available Services list and click any of the following buttons, which are available alongside. The table below lists the buttons and indicates what will happen if a button is clicked.
Button Purpose 
Click on this button to move the selection a level higher.

Click on this button to move the selection a level lower

Click on this button to move the selection to the top of the list

Click on this button to move the selection to the bottom of the list
- Finally, click the Update button to save the changes.
- Moreover, super-users to the eG Enterprise system (i.e., users with Admin or Supermonitor rights) can share the changes they make to the business dashboard with other users, so that some/all users receive a consistent view of the demand, consumption, and quality of the service. For this purpose, the super-user needs to follow the steps detailed below:
- Once changes are made to one/more service displays in the business dashboard, click the
 icon at the right, top corner of Figure 1.
 -
Figure 13 will then appear. From the Applies to drop-down, select a service. The changes made by the super-user to the business dashboard settings of this service will then be shared with other users. To share changes effected on all services, pick the All Services option.
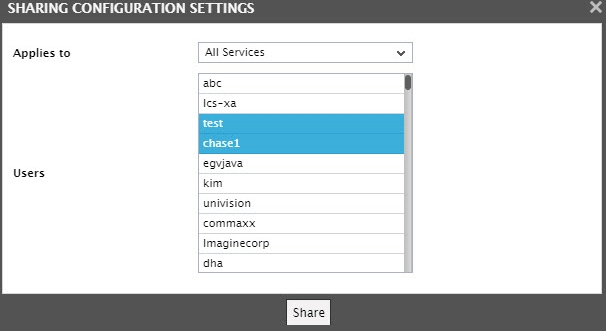
Figure 13 : Selecting the users with whom the dashboard changes are to be shared
- Then, from the Users list, select the users with whom the dashboard changes of the chosen service are to be shared.
- Finally, click the Share button to share.
