
Topology Tab Page
When multiple inter-related components that are part of a segment experience slowdowns, it is often a challenge for administrators to accurately diagnose the 'source' of the slowdown - this is because, the problem in one segment component can affect the performance of other segment components that are dependent on it. To enable administrators to easily understand the inter-relationships between the various components that form a segment, and to help them precisely locate the root-cause of problems with a segment, the segment dashboard provides the Topology tab page. If you click on this tab page after selecting a segment node from the tree, Figure 1 will appear. This tab page will also appear when you click on a particular segment name in the segment list of Figure 2.
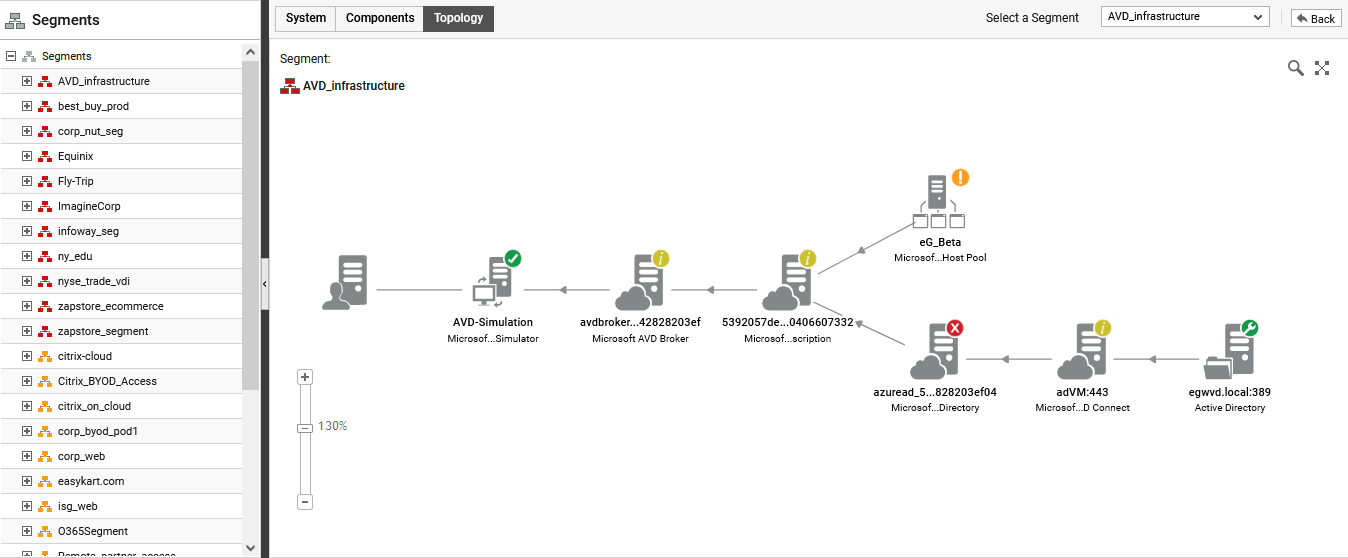
Figure 1 : The Topology tab page of the Segment dashboard
From the color-coding of the segment components in the topology and the direction of dependencies represented by the 'arrows' in the topology, you will be able to accurately isolate the root-cause of problems in the segment. Clicking on a component in the topology will reveal the layer model of that component.
Large enterprises often have load balanced groups of servers providing web, middleware, and database functionality. The servers in the group often perform the same functions and have the same set of dependencies on other infrastructure components. For a service with tens of servers in a group, the service topology representation can quickly get very cumbersome. To handle such environments, eG Enterprise allows administrators to define server groups that represent a collection of similar servers. By including a server group in a service topology representation, administrators can indicate that all the servers in the group have the same set of dependencies on other parts of the infrastructure. Topology representation using server groups are compact and concise to represent, and simple to understand.
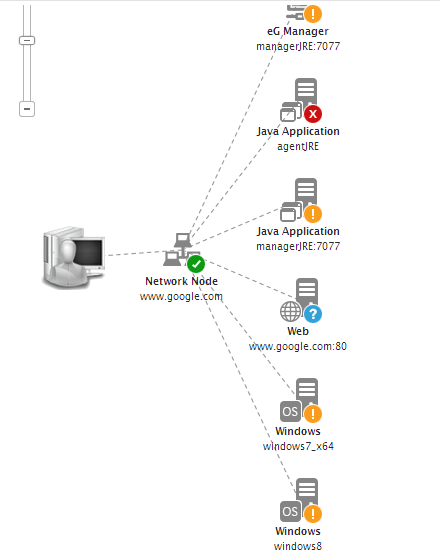
Figure 2 : The topology of a segment comprising of a group
Clicking on the group representation in Figure 2 will lead you to Figure 2, which displays all the components associated with the group and their current state. If there is an issue with the group, then the group list will reveal which component in the group is causing the problem.
