
Detailed Diagnostics Revealing that Slow Node.js Processing is the Reason for Transaction Slowness
Let us consider the example of a Node.js application, where the following transactions are slow.
![]()
Figure 1 : Detailed diagnosis of the Slow transactions percentage measure
Let us focus on the first transaction in the slow transactions list of Figure 1. To zoom into the transaction, click on it. Figure 2 will then appear revealing the cross-application flow of that transaction.
![]()
Figure 2 : The cross-application flow of the slow transaction
This flow diagram clearly reveals the following:
- The Node.js application and backends through which the transaction travelled;
- The time for which the transaction request was processed at the BTM-enabled Node.js application If multiple Node.js applications are in the transaction path, then, note that this time will not be computed for Node.js applications that are in the transaction path, but are not BTM-enabled and those that are BTM-enabled but are not managed by eG Enterprise;
-
The exit calls made by each BTM-enabled node to another node as part of the transaction's journey, the time consumed by each exit call, and the number of times each type of call was made; the following exit calls are supported by eG Node.js BTM:
- Database Query
- HTTP
- Messaging calls via RabbitMQ AQMP protocol
Note:
-
If a profiled node appears 'grayed out' in the cross-application transaction flow, it denotes that profiler could not collect detailed diagnostics for that node. The reasons for this could be either or both of the following:
- Transaction responsiveness on the 'grayed out' node was either healthy or was only slightly slow, and hence, did not appear in the list of Top-N slow transactions.
- Slow data transmission from eG agent to manager;
- If a Node.js application makes a call to a messaging server, then. in the transaction topology, that messaging server will be identified by the URL of the exact queue/topic that is managing the request. If a Node.js application makes a SQL query call to a database server, then the details displayed for that database server in the transaction topology depends upon whether/not that database server is managed by eG Enterprise. If the database server is not managed by eG Enterprise, then such a database server will be represented in the topology using the server type (whether Oracle, Microsoft SQL etc.) and the name of the database that was accessed by the SQL query. To know the IP and port number of the unmanaged database server, you can drill-down from the Database queries call in the topology. On the other hand, if the database server in question is being monitored by eG Enterprise, then such a server will be represented in the topology using the server type, nick name, port number, and the database name. Additionally, the SID will be displayed in case of an Oracle database server, and the instance name will be displayed in case of an instance-based Microsoft SQL server.
-
Sometimes, empty nodes – i.e., nodes without any details – will be visible in the cross-application transaction flow topology. Likewise, the time spent on certain external calls may also not be displayed in the topology. This is owing to inconsistencies in the collection of detailed diagnostics.
Using conventional color codes and intuitive icons, the transaction flow chart precisely pinpoints where the transaction slowed down. In the case of above, from the color-coding it is clear that the problem is with the Application Transactions layer of the Node.js application, best-bags-application:3000. To zoom into the problem, click on that Node.js application in the transaction topology. will then appear providing a detailed Execution Analysis of the Node.js methods called by best-bags-application:3000.
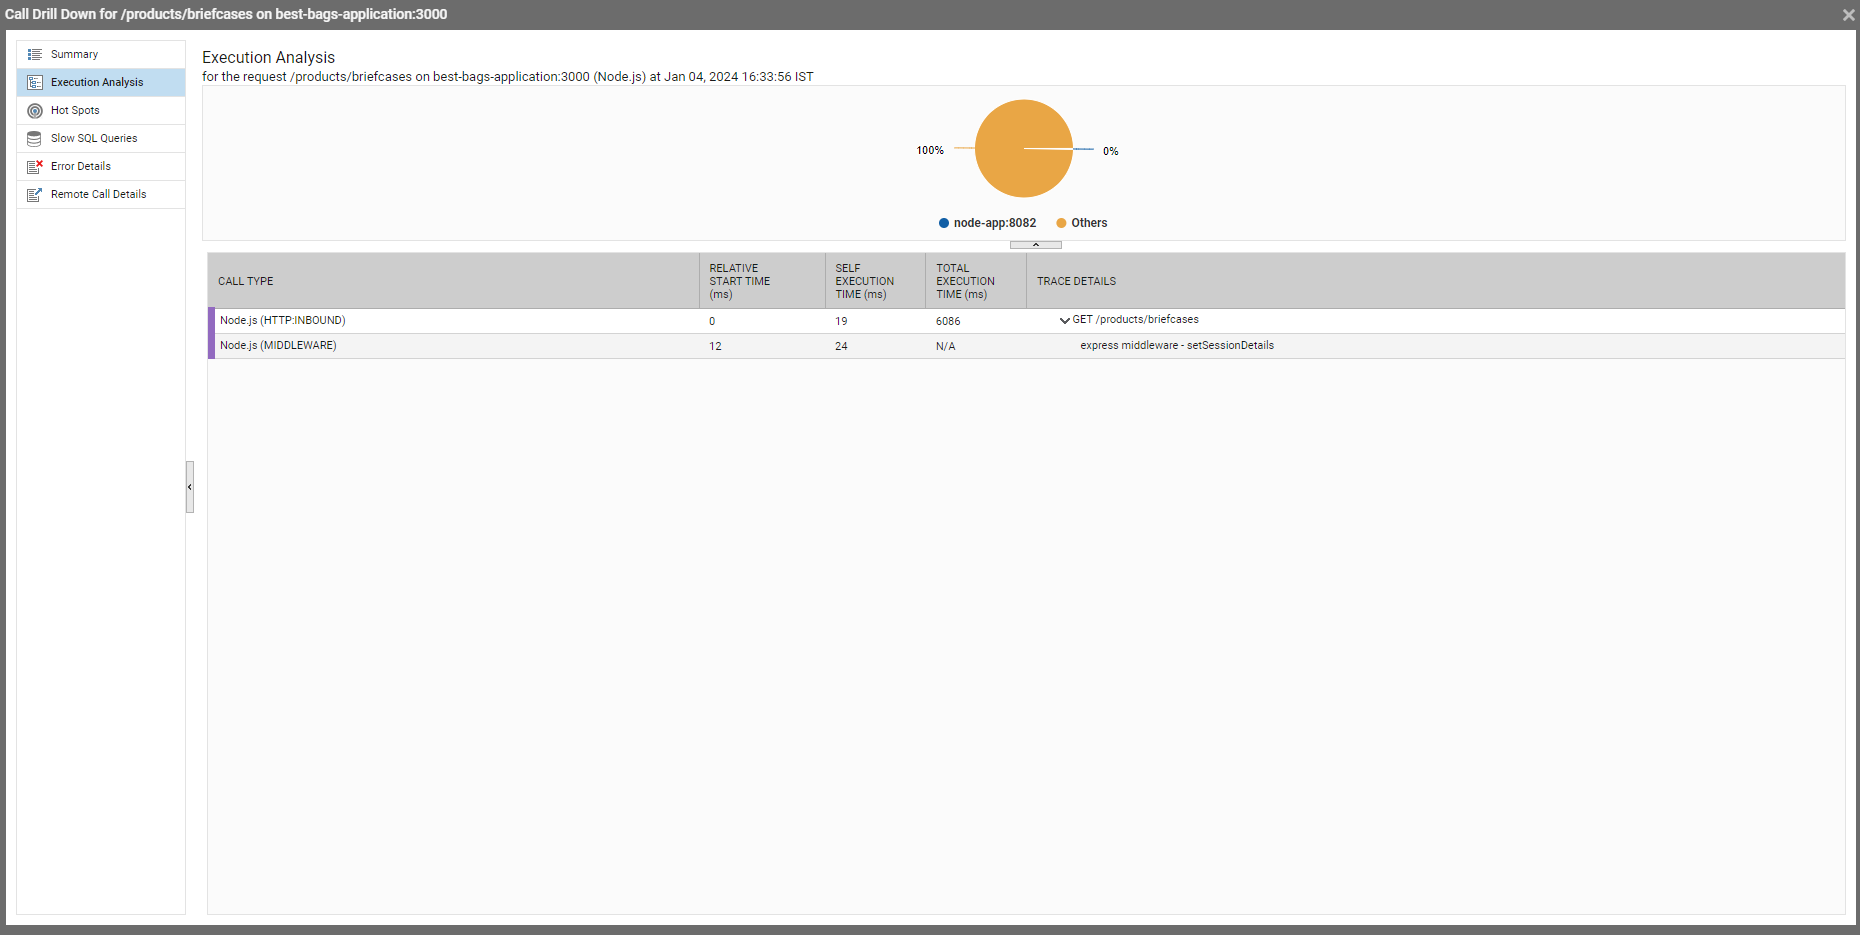
Figure 3 : The call graph of the Node.js transaction
As part of this analysis, a pie chart is presented that quickly reveals the percentage of time best-bags-application:3000 in our example spent processing the Node.js application code and making external HTTP/Database/Messaging calls. The table below the pie chart in Figure 3 lists the exact methods that performed Node.js processing or made the remote calls. A quick look at this table reveals that the Node.js method, GET/products/briefcases invoked a series of child methods and external calls, which together took over 6086 milliseconds to execute.
This way, eG Node.js BTM enables you to diagnose the root-cause of slowness in your Node.js calls using just a few mouse clicks!
