
Node.js Garbage Collections Test
Every application needs memory to work properly. Memory management provides ways to dynamically allocate memory chunks for programs when they request it, and free them when they are no longer needed – so that they can be reused.
Application-level memory management can be manual or automatic. The automatic memory management usually involves a garbage collector. The job of the garbage collector (GC) is to reclaim memory occupied by unused objects (garbage). The Garbage Collection events cleaning out different parts inside heap memory are often called Minor, Major and Full GC event types. Collecting garbage from the Young space (new objects) is called Minor GC while collecting garbage from Old space is called Major GC. If garbage is collected from both Young space and Old space, it is called Full GC. Often, administrators had to keep track on how well the heap memory is reclaimed and through which type of garbage collection was the heap memory retained. This analysis will help them fine-tune their garbage collection operations. The Node.js Garbage Collections test helps administrators perform such analysis.
This test auto-discovers the types of garbage collection performed on the target Node.js server and for each type of garbage collection, this test reports the time the spent in collecting garbage. Administrators will also be alerted if too much time is being spent in garbage collection. The test also reveals the amount of memory reclaimed as part of the garbage collection activity. This way, the test enables administrators to periodically review the garbage collection activity, assess its impact on application performance, and figure out if it needs to be fine-tuned to reduce application latencies.
Target of the test : A Node.js V8 Engine
Agent deploying the test : An internal agent
Outputs of the test : One set of results for each type of garbage collection activity performed on the target Node.js server being monitored
| Parameter | Description |
|---|---|
|
Test Period |
How often should the test be executed. |
|
Host |
The IP address of the host for which this test is to be configured. |
|
Port |
The port at which the target Host listens to. By default this is 3000. |
|
DD Frequency |
Refers to the frequency with which detailed diagnosis measures are to be generated for this test. The default is 1:1. This indicates that, by default, detailed measures will be generated every time this test runs, and also every time the test detects a problem. You can modify this frequency, if you so desire. Also, if you intend to disable the detailed diagnosis capability for this test, you can do so by specifying none against DD frequency. |
|
Detailed Diagnosis |
To make diagnosis more efficient and accurate, the eG Enterprise embeds an optional detailed diagnostic capability. With this capability, the eG agents can be configured to run detailed, more elaborate tests as and when specific problems are detected. To enable the detailed diagnosis capability of this test for a particular server, choose the On option. To disable the capability, click on the Off option. The option to selectively enable/disable the detailed diagnosis capability will be available only if the following conditions are fulfilled:
|
| Measurement | Description | Measurement Unit | Interpretation |
|---|---|---|---|
|
Avg GC frequency |
Indicates the average frequency with which garbage collection of this type was performed. |
Seconds |
If adequate memory is not allotted to the Node.js application, then the value of this measure would be very low. A low value of this measure is indicative of a high frequency of GC. This is not a good sign, as GC, during its execution, has the tendency of suspending an application, and a high frequency of GC would only adversely impact the application's performance. To avoid this, it is recommended that you allot sufficient memory to the Node.js application. |
|
Avg GC overhead |
Indicates the percentage of time taken for garbage collection of this type. |
Percent |
By carefully examining the application behavior in terms of memory utilization, you should arrive at an optimal ratio of the number of times the GC needs to run and how long it should take to complete. Accordingly, memory can be allotted to each Node.js process. Compare the value of this measure across the types of garbage collection to identify the type of garbage collection that too long to complete. |
|
Avg GC pause |
Indicates the average time the application is suspended while garbage collection of this type was in progress. |
Seconds |
If the garbage collection takes more time to complete, then it indicates a very high memory allocation to the Node.js application. This may hinder application performance. |
|
Avg heap after GC |
Indicates the average heap size after garbage collection of this type. |
MB |
The difference between the value of this measure and the Avg heap before GC measure provides the amount of memory that has been released by GC activity of each type. This value is a good indicator of the effectiveness of GC. |
|
Avg heap before GC |
Indicates the average heap size prior to garbage collection of this type. |
MB |
|
|
Max GC pause |
Indicates the maximum time spent on garbage collection of this type during the last measurement period. |
Seconds |
|
|
Number of GC |
Indicates the number of garbage collections of this type that occurred on this instance during the last measurement period. |
Number |
Compare the value of this measure across garbage collection types to identify the type of garbage collection that has happened very often. When garbage collections occurs frequently, it indicates that the Node.js inatance could have experienced rapid and abnormal heap growth. |
|
Total GC time |
Indicates the total time taken for this type of garbage collection to complete on this instance. |
Seconds |
Ideally, the value of this measure should be low. This is because, the garbage collection (GC) activity tends to suspend the operations of the application until such time that GC ends. Longer the GC time, longer it would take for the application to resume its functions. To minimize the impact of GC on application performance, it is best to ensure that GC activity does not take too long to complete. |
|
Total reclaimed bytes |
Indicates the memory reclaimed by the garbage collector when this type of garbage collection occurred on this instance. |
MB |
Compare the value of this measure across garbage collection types to know which type of garbage collection activity was performed by the garbage collector to reclaim maximum memory and which type of garbage collection activity was performed to reclaim the least amount of memory. |
|
Avg reclaimed bytes |
Indicates the average amount of memory reclaimed by the garbage collector while performing garbage collection of this type. |
MB |
|
|
Percent of time spent for garbage collection |
Indicates the percentage of time spent to perform garbage collection of this type. |
Percent |
Compare the value of this measure across the types of garbage collection performed to identify the type of garbage collection that was performed for a longer duration. |
The detailed diagnosis of the Number of GC measure lists the time stamp of each garbage collection, heap before GC, heap after GC, total garbage collection time and the reclaimed bytes after each garbage collection.
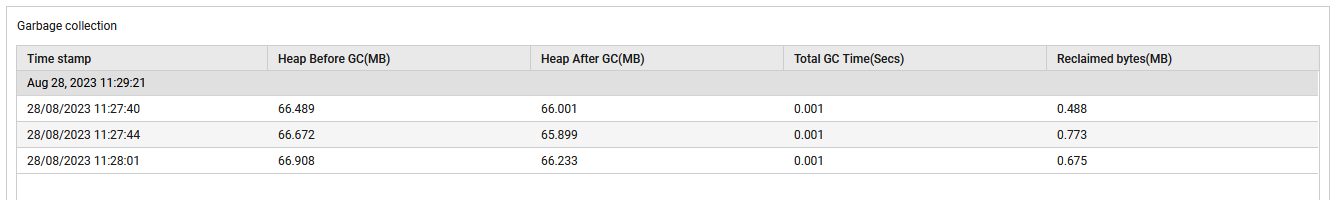
Figure 1 : The detailed diagnosis of the Number of GC measure
