
AHV Physical Disks Test
Monitoring each physical disk grouped in a storage pool provides administrators with insights into the status, configuration, and usage of each disk. This in turn enables administrators to isolate disks that are running out of free space and those that are experiencing serious processing bottlenecks, so that such disks can be marked for resizing or tuning. Using the AHV Physical Disks test, administrators can receive such useful physical disk-level performance insights!
For each physical disk, this test reports the current status, type, and mode of the test. In addition, the test measures the space usage and I/O processing ability of each disk, and warns administrators of a probable space contention, a potential overload, or a possible processing snag on a disk. This way, the test enables administrators to ensure high disk performance and availability.
Target of the test : A Nutanix AHV server
Agent deploying the test : A
Outputs of the test : One set of results for each physical disk of the Nutanix AHV server monitored.
| Parameter | Description |
|---|---|
|
Test Period |
How often should the test be executed |
|
Host |
The host for which the test is to be configured. |
|
Port |
The port at which the specified host listens. By default, this is NULL |
|
Prism Element IP |
If the eG manager had discovered the target Nutanix AHV server by connecting to the Nutanix Prism Element, then the IP address of the Nutanix Prism Element server used for discovering this Nutanix AHV server would be automatically displayed against the Prism Element IP parameter; similarly, the Prism Element User and Prism Element Password text boxes will be automatically populated with the Prism Element user credentials, using which Nutanix AHV discovery was performed. If this Nutanix AHV server has not been discovered using the Nutanix Prism Element, but you still want to monitor the Nutanix AHV server via the Prism Element, then select the IP address of the Prism Element server that you wish to use for monitoring the Nutanix AHV server from the Prism Element IP list. By default, this list is populated with the IP address of all Nutanix Prism Element hosts that were added to the eG Enterprise system at the time of discovery. Upon selection, the Prism Element user and Prism Element Password that were pre-configured for that Nutanix Prism Element will be automatically displayed against the respective text boxes. On the other hand, if the IP address of the Prism Element server of interest to you is not available in the list, then, you can add the details of the Prism Element server on-the-fly, by selecting the Other option from the Prism Element IP list. This will invoke the MANAGER DISCOVERY - VIRTUAL PLATFORM SETTINGS page. Refer to the Configuring eG Enterprise to Monitor Nutanix AHV |
|
Prism Element User, Prism Element Password and Confirm Password |
If the eG manager had discovered the target Nutanix AHV server by connecting to the Nutanix Prism Element, then the IP address of the Nutanix Prism Element server used for discovering this Nutanix AHV server would be automatically displayed against thePrism Element IP parameter; similarly, the Prism Element User and Prism Element Password text boxes will be automatically populated with the Prism Element user credentials, using which Nutanix AHV discovery was performed. If this Nutanix AHV server has not been discovered using the Nutanix Prism Element, but you still want to monitor the Nutanix AHV server via the Prism Element, then select the IP address of the Prism Element server that you wish to use for monitoring the Nutanix AHV server from the Prism Element IP list. By default, this list is populated with the IP address of all Nutanix Prism Element hosts that were added to the eG Enterprise system at the time of discovery. Upon selection, the Prism Element User and Prism Element Password that were pre-configured for that Prism Element server will be automatically displayed against the respective text boxes. On the other hand, if the IP address of the Prism Element server of interest to you is not available in the list, then, you can add the details of the Prism Element server on-the-fly, by selecting the Other option from the Prism Element IP list. This will invoke the MANAGER DISCOVERY - VIRTUAL PLATFORM SETTINGS page. Refer to the Configuring eG Enterprise to Monitor Nutanix AHV |
|
SSL |
By default, the Nutanix Prism Element server is SSL-enabled. Accordingly, the SSL flag is set to Yes by default. This indicates that the eG agent will communicate with the Prism Element server via HTTPS by default. |
|
WebPort |
By default, the Nutanix Prism Element server listens on port 9440. This implies that while monitoring a Nutanix AHV server via the Prism Element server, the eG agent connects to port 9440. |
|
DD Frequency |
Refers to the frequency with which detailed diagnosis measures are to be generated for this test. The default is 1:1. This indicates that, by default, detailed measures will be generated every time this test runs, and also every time the test detects a problem. You can modify this frequency, if you so desire. Also, if you intend to disable the detailed diagnosis capability for this test, you can do so by specifying none against DD frequency. |
|
Detailed Diagnosis |
To make diagnosis more efficient and accurate, the eG Enterprise embeds an optional detailed diagnostic capability. With this capability, the eG agents can be configured to run detailed, more elaborate tests as and when specific problems are detected. To enable the detailed diagnosis capability of this test for a particular server, choose the On option. To disable the capability, click on the Off option. The option to selectively enable/disable the detailed diagnosis capability will be available only if the following conditions are fulfilled:
|
| Measurement | Description | Measurement Unit | Interpretation | |||||||||||||||
|---|---|---|---|---|---|---|---|---|---|---|---|---|---|---|---|---|---|---|
|
Status |
Indicates the current status of this disk. |
|
The values that this measure can report, their description, and their corresponding numeric values are detailed in the table below:
Note: By default, this measure reports the Measure Values listed in the table above to indicate disk status. In the graph of this measure however, status is represented using the numeric equivalents only. Use the detailed diagnosis of the Status measure to view the UUID of the disk and the cluster to which it is attached. |
|||||||||||||||
|
Disk type |
Indicates the disk type. |
|
The values that this measure can report and their corresponding numeric values are detailed in the table below:
Note: By default, this measure reports the Measure Values listed in the table above to indicate the disk type. In the graph of this measure however, the disk type is represented using the numeric equivalents only. Use the detailed diagnosis of the Status measure to view the UUID of the disk and the cluster to which it is attached. |
|||||||||||||||
|
Mode |
Indicates whether the disk is currently online or offline. |
|
The values that this measure can report and their corresponding numeric values are listed in the table below:
Note: By default, this measure reports the Measure Values listed in the table above to indicate the disk mode. In the graph of this measure however, the mode is indicated using the numeric equivalents only. |
|||||||||||||||
|
Is marked for removal? |
Indicates whether/not the disk is ready to be removed. |
|
The values that this measure can report and their corresponding numeric values are listed in the table below:
Note: By default, this measure reports the Measure Values listed in the table above to indicate whether/not the disk is ready to be removed. In the graph of this measure however, the same is indicated using the numeric equivalents only. |
|||||||||||||||
|
Is data migrated? |
Indicates whether/not the data in this disk is migrated. |
|
The values that this measure can report and their corresponding numeric values are listed in the table below:
Note: By default, this measure reports the Measure Values listed in the table above to indicate whether/not the data is migrated. In the graph of this measure however, the same is indicated using the numeric equivalents only. |
|||||||||||||||
|
Is self encrypting drive? |
Indicates whether/not this is a self-encrypting drive. |
|
The values that this measure can report and their corresponding numeric values are listed in the table below:
Note: By default, this measure reports the Measure Values listed in the table above to indicate whether/not the disk is a self-encrypting drive. In the graph of this measure however, the same is indicated using the numeric equivalents only. |
|||||||||||||||
|
Disk capacity |
Indicates the total capacity of this disk. |
GB |
|
|||||||||||||||
|
Disk used space |
Indicates the amount of space in this disk that is currently in use. |
GB |
A low value is desired for this measure. |
|||||||||||||||
|
Disk free space |
Indicates the amount of space in this disk that is still unused. |
GB |
A high value is desired for this measure. |
|||||||||||||||
|
Disk space utilization |
Indicates the percentage of disk capacity that is being utilized. |
Percent |
A value close to 100% indicates that the disk is rapidly running out of space. |
|||||||||||||||
|
Percent free space in disk |
Indicates of percentage of disk capacity that is free and is available for use. |
Percent |
A value less than 50% indicates that the disk is rapidly running out of space. |
|||||||||||||||
|
Disk logical usage |
Indicates the amount of logical storage space in this disk that is in use currently. |
GB |
|
|||||||||||||||
|
Total I/O latency |
Indicates the average time taken by this disk to process I/O requests. |
Secs |
Ideally, the value of this measure should be very low. A high value or a steady increase in this value could indicate an I/O processing bottleneck on this disk. In such a case, compare the value of the Read IO latency and Write IO latency measures to figure out when the slowness is worst - when processing read requests? or write requests? |
|||||||||||||||
|
Read IO latency |
Indicates the average time taken by this disk to process read I/O requests. |
Secs |
If the Total I/O latency measure reports an abnormally high value, then compare the value of these measures to figure out where the slowness is maximum - when processing read requests? or write requests?
|
|||||||||||||||
|
Write IO latency |
Indicates the average time taken by this disk to process write I/O requests. |
Secs |
||||||||||||||||
|
Total IO bandwidth |
Indicates the bandwidth per second used by this disk when processing I/O requests. |
KB/Sec |
A high value for this measure denotes that this disk is processing bandwidth-intensive I/O. In such situations, you may want to compare the value of the Read IO bandwidth and Write IO bandwidth measures to know what type of I/O requests are truly contributing to the excessive bandwidth consumptions - read requests? or write requests? |
|||||||||||||||
|
Read IO bandwidth |
Indicates the bandwidth per second used by this disk when processing read I/O requests. |
KB/Sec |
If the value of the Total IO bandwidth measure is high, then you may want to compare the value of the Read IO bandwidth and Write IO bandwidth measures to know what type of I/O requests are truly contributing to the excessive bandwidth consumption - read requests? or write requests?
|
|||||||||||||||
|
Write IO bandwidth |
Indicates the bandwidth per second used by this disk when processing write I/O requests. |
KB/Sec |
||||||||||||||||
|
Total IOPS |
Indicates the number of I/O operations performed currently on this disk. |
Number |
This measure is a good indicator of the level of I/O activity on the Nutanix storage. A steady and significant increase in the value of this measure could indicate a potential I/O overload. In such situations, you may want to compare the value of the Read IOPS and Write IOPS measures to know what type of IO operations are contributing to the overload. |
|||||||||||||||
|
Read IOPS |
Indicates the number of read I/O operations performed currently on this disk. |
Number |
If the value of the Total IOPS measure is unusually high, then compare the value of these measures to know what is contributing to the unusual I/O activity levels - read requests? or write requests? |
|||||||||||||||
|
Write IOPS |
Indicates the number of write I/O operations performed currently on the container. |
Number |
Use the detailed diagnosis of the Status measure to view the UUID of the disk and the cluster to which it is attached.
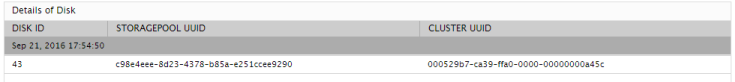
Figure 1 : The detailed diagnosis of the Status measure
